Nebraska Department of Environment and Energy

Air Water Land Energy

Nebraska Energy Statistics

Energy Expenditures in
Nebraska's Industrial Sector

The industrial sector consists of manufacturing, construction, mining, agriculture, and forestry organizations. Energy used by this sector to transport products to market or inputs to the organizations is included in the transportation sector.

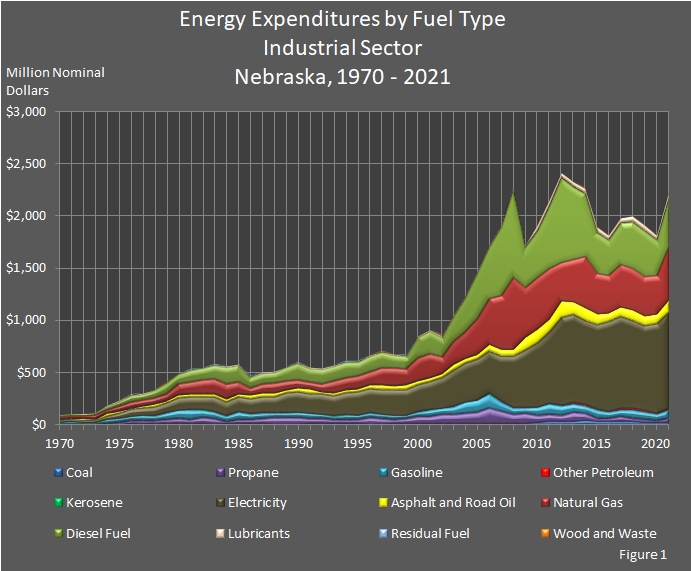
Total industrial sector expenditures on energy increased 22.7 percent to $2,219.6 million from 2020 to 2021. In 2021, the industrial sector spent $914.4 million for electricity, $516.5 million for natural gas, $462.9 million for diesel fuel, $115.4 million for asphalt and road oil, $76.6 million for motor gasoline, $52.3 million for lubricants, $36.1 million for propane, $24.1 million for coal, $20.4 million for other petroleum products (a definition is in the next paragraph), and $0.8 million for wood and waste. Expenditures for residual fuel and kerosene were not reported. There were no direct fuel costs for hydroelectric, geothermal, wind, photovoltaic, or solar thermal energy. The cost for ethanol is not being tracked so there is no expenditure to report.

Other petroleum products included sixteen (16) separate products, all of which were assigned to the industrial sector. The sixteen products are:

  1. aviation gasoline blending components;
  2. crude oil;
  3. motor gasoline blending components;
  4. natural gasoline, including isopentane;
  5. pentanes plus;
  6. petrochemical feedstocks, naphtha;
  7. petrochemical feedstocks, other oils;
  8. petrochemical feedstocks, still gas;
  9. petroleum coke;
  10. plant condensate;
  11. special naphthas;
  12. still gas;
  13. unfinished oils;
  14. unfractionated streams;
  15. waxes; and
  16. miscellaneous.
    • Miscellaneous products varied from inexpensive (absorption oils similar to kerosene) to very expensive (hydraulic fluids) products. The greater part of the miscellaneous product line consisted of finished petrochemicals, especially the aromatic hydrocarbons:  benzene, toluene, and the xylenes.

Nearly all of the money (98 percent) spent in the industrial sector on energy in 2021 went to electricity (41 percent), petroleum products (34 percent), and natural gas (23 percent) expenditures. Coal expenditures were 1.09 percent of the total expenditures. Renewable energy expenditures were 0.04 percent of the industrial sector's energy expenditures; renewable energy expenditures were comprised of wood and waste. The cost for ethanol is not being tracked so there is no expenditure to report. Within the petroleum category, expenditures on diesel fuel comprised 61 percent of the petroleum category, asphalt and road oil expenditures were 15 percent, motor gasoline expenditures were 10 percent, lubricants expenditures were 7 percent, and propane expenditures were 5 percent. Expenditures on each of the rest of the petroleum products were less than 3 percent of the petroleum category.

The expenditures are in nominal dollars to provide a better comparison.

Return to top of page

graphic showing Energy Expenditures by Fuel Type in the Industrial Sector in Nebraska

Return to top of page

Energy Expenditures by Fuel Type,
Industrial Sector,
Nebraska, 2010 – 2020

(Million Nominal Dollars)

Year Coal Electricity Natural Gas Petroleum Renewable Annual Total
Asphalt and Road Oil Diesel Fuel Kerosene Lubri­cants Motor Gasoline Other Petroleum1 Propane Residual Fuel Ethanol Wood and Waste
2021 $24.1 $914.4 $516.5 $115.4 $462.9 $0.0 $52.3 $76.6 $20.4 $36.1 $0.0 NA $0.8 $2,219.6
2020 $21.1 $853.7 $368.1 $88.9 $344.9 $0.0 $42.3 $55.3 $12.3 $21.2 $0.0 NA $1.0 $1,808.9
2019 $24.2 $812.6 $383.0 $85.1 $442.7 $0.1 $43.1 $66.5 $18.7 $26.2 $0.0 NA $1.0 $1,903.2
2018 $31.4 $834.0 $401.0 $67.2 $450.9 $0.0 $40.6 $73.2 $22.4 $33.6 $0.0 NA $0.6 $1,954.9
2017 $34.8 $873.2 $406.4 $56.5 $407.4 $0.0 $37.4 $65.0 $11.5 $42.6 $0.0 NA $0.5 $1,935.3
2016 $32.4 $857.7 $367.7 $48.6 $339.2 $0.0 $39.5 $57.6 $9.7 $28.1 $0.0 NA $0.6 $1,781.1
2015 $36.20 $808.8 $390.4 $76.0 $394.7 $0.0 $43.1 $70.6 $11.0 $34.4 $0.0 NA $0.3 $1,836.8
2014 $40.10 $797.1 $494.3 $96.2 $604.9 $0.1 $44.0 $65.9 $18.7 $61.5 $0.0 NA $0.3 $2,192.8
2013 $36.5 $837.4 $416.0 $90.9 $696.8 $0.1 $43.7 $80.4 $19.3 $76.7 $0.0 NA $0.3 $2,267.4
2012 $35.4 $834.9 $370.8 $115.0 $812.4 $0.1 $45.4 $85.7 $7.1 $62.4 $0.0 NA $0.2 $2,336.8
2011 $35.2 $681.0 $483.2 $95.0 $604.8 $0.1 $49.1 $95.3 $7.1 $61.4 $0.0 NA $0.2 $2,076.8
2010 $23.8 $613.0 $498.3 $97.4 $454.7 $0.1 $43.0 $73.7 $6.1 $63.5 $0.0 $2.8 $2.7 $1,845.3

Return to top of page

Energy Expenditures by Fuel Type,
Industrial Sector,
Nebraska, 1990 – 2009

(Million Nominal Dollars)

Year Coal Electricity Natural Gas Petroleum Renewable Annual Total
Asphalt and Road Oil Diesel Fuel Kerosene Lubri­cants Motor Gasoline Other Petroleum1 Propane Residual Fuel Ethanol Wood and Waste
2009 $16.5 $547.1 $486.9 $79.5 $384.8 $0.3 $10.4 $47.0 $3.9 $96.6 $0.0 $2.1 $2.6 $1,675.7
2008 $17.6 $496.4 $695.5 $50.3 $840.4 $0.1 $11.3 $59.8 $6.9 $79.7 $3.0 $2.7 $2.4 $2,263.5
2007 $17.0 $434.8 $523.3 $52.1 $657.4 $0.2 $10.4 $85.0 $5.4 $114.4 $2.5 $2.1 $2.4 $1,905.1
2006 $15.4 $409.0 $447.0 $54.4 $495.3 $0.3 $9.4 $136.1 $5.4 $139.3 $1.7 $1.9 $2.2 $1,715.4
2005 $10.0 $390.6 $343.1 $41.6 $439.2 $0.6 $7.8 $116.5 $3.6 $105.4 $4.3 $1.7 $1.3 $1,464.0
2004 $9.0 $368.9 $259.6 $41.2 $325.5 $0.5 $6.7 $98.9 $3.2 $104.3 $5.7 $2.7 $1.2 $1,224.8
2003 $8.8 $351.9 $223.4 $42.1 $243.2 $0.3 $6.3 $69.1 $2.9 $91.3 $3.1 $2.0 $1.3 $1,043.7
2002 $9.1 $293.9 $171.8 $23.0 $192.6 $0.1 $6.3 $58.5 $3.0 $91.1 $2.6 $1.6 $1.3 $853.4
2001 $11.6 $275.8 $235.7 $24.3 $218.9 $0.3 $5.9 $57.5 $3.7 $70.6 $2.7 $1.2 $0.4 $907.3
2000 $11.6 $262.8 $216.3 $29.5 $210.6 $0.3 $6.1 $39.9 $2.3 $69.8 $2.8 $1.0 $0.2 $852.2
1999 $11.2 $245.9 $154.6 $38.7 $122.5 $0.1 $6.1 $31.2 $2.5 $47.0 $1.2 $0.6 $0.2 $661.2
1998 $10.4 $248.8 $173.0 $28.6 $124.1 $0.3 $5.6 $44.7 $2.7 $36.7 $1.6 $0.7 $0.2 $676.7
1997 $8.1 $237.7 $171.0 $33.0 $146.8 $0.5 $5.5 $40.6 $3.4 $50.4 $1.7 $0.7 $1.2 $700.0
1996 $7.8 $227.7 $118.9 $36.7 $156.9 $0.4 $5.1 $40.4 $3.6 $64.4 $3.1 $0.6 $1.6 $666.5
1995 $9.4 $222.9 $124.9 $20.2 $134.6 $0.3 $5.3 $36.5 $4.0 $43.9 $1.8 $0.8 $0.0 $603.7
1994 $11.5 $213.3 $115.3 $19.9 $151.7 $0.3 $5.4 $35.4 $4.2 $44.8 $2.5 $0.7 $0.0 $604.3
1993 $9.8 $200.4 $119.5 $15.5 $144.0 $0.3 $5.3 $33.2 $3.2 $38.8 $3.7 $1.0 $0.0 $573.5
1992 $9.4 $193.2 $77.2 $15.6 $146.7 $0.3 $5.3 $39.4 $3.8 $50.4 $1.8 $1.4 $0.0 $544.4
1991 $8.8 $194.7 $68.3 $29.9 $141.3 $0.3 $5.2 $46.6 $2.4 $52.5 $2.2 $1.4 $0.0 $553.5
1990 $6.6 $193.5 $76.5 $29.0 $164.4 $0.6 $5.3 $47.4 $7.4 $60.6 $3.3 $1.2 $0.0 $595.7

Return to top of page

Energy Expenditures by Fuel Type,
Industrial Sector,
Nebraska, 1970 – 1989

(Million Nominal Dollars)

Year Coal Electricity Natural Gas Petroleum Renewable Annual Total
Asphalt and Road Oil Diesel Fuel Kerosene Lubri­cants Motor Gasoline Other Petroleum1 Propane Residual Fuel Ethanol Wood and Waste
1989 $7.9 $184.0 $89.2 $23.2 $127.9 $0.3 $4.7 $46.8 $8.9 $58.2 $3.4 $1.3 $0.0 $555.8
1988 $7.9 $158.0 $92.1 $29.7 $111.1 $1.5 $4.4 $40.3 $6.1 $60.0 $4.3 $0.9 $0.0 $516.1
1987 $9.4 $149.0 $83.2 $31.7 $111.9 $2.4 $4.3 $49.7 $6.7 $51.1 $3.4 $1.1 $0.0 $504.0
1986 $10.4 $146.4 $66.3 $24.9 $105.6 $3.9 $4.0 $45.5 $6.6 $42.4 $3.5 $0.8 $0.0 $460.4
1985 $12.2 $148.5 $119.4 $15.8 $162.3 $0.9 $4.1 $70.8 $5.6 $35.1 $1.7 $1.2 $0.0 $577.6
1984 $9.2 $139.3 $140.1 $20.8 $167.0 $1.0 $4.4 $48.2 $5.5 $23.8 $2.0 $0.8 $0.0 $562.3
1983 $7.1 $146.4 $138.8 $21.5 $137.9 $1.0 $4.0 $55.2 $5.9 $56.4 $2.9 $0.9 $0.0 $578.0
1982 $11.0 $130.7 $131.1 $21.8 $111.8 $1.7 $3.8 $67.8 $6.0 $57.2 $2.5 $0.5 $0.0 $545.9
1981 $13.8 $123.9 $113.6 $24.5 $113.9 $1.8 $4.3 $81.0 $6.8 $42.6 $0.7 $0.3 $0.0 $527.3
1980 $8.7 $123.0 $101.1 $18.6 $98.1 $0.9 $3.6 $77.7 $3.3 $51.0 $0.3 $0.0 $0.0 $486.3
1979 $17.4 $98.0 $61.3 $14.0 $108.6 $0.5 $2.9 $60.8 $2.6 $34.8 $0.4 $0.0 $0.7 $402.0
1978 $15.8 $84.2 $55.9 $23.5 $73.2 $1.9 $2.0 $46.6 $2.2 $22.7 $1.0 $0.0 $0.7 $329.6
1977 $12.3 $73.7 $60.9 $15.0 $56.4 $1.7 $1.7 $45.4 $1.7 $27.8 $1.6 $0.0 $0.6 $298.7
1976 $12.0 $70.2 $53.8 $7.7 $62.0 $1.8 $9.2 $42.7 $1.8 $25.3 $1.2 $0.0 $0.5 $288.1
1975 $4.8 $54.0 $49.2 $10.3 $42.3 $1.5 $8.8 $41.1 $1.4 $16.5 $0.8 $0.0 $0.4 $231.1
1974 $3.6 $37.2 $37.2 $11.6 $35.7 $1.5 $8.3 $36.1 $1.4 $13.1 $0.6 $0.0 $0.4 $186.8
1973 $1.5 $31.0 $30.5 $5.1 $19.2 $0.8 $6.4 $11.8 $1.4 $4.6 $0.8 $0.0 $0.5 $113.6
1972 $1.0 $26.8 $26.5 $5.1 $16.2 $0.7 $4.7 $19.5 $1.0 $4.6 $0.4 $0.0 $0.4 $107.0
1971 $1.6 $26.7 $19.6 $6.1 $15.2 $0.7 $4.1 $23.6 $0.9 $3.6 $0.3 $0.0 $0.2 $102.6
1970 $0.8 $25.0 $17.0 $5.3 $14.0 $0.6 $4.9 $21.0 $0.0 $3.4 $0.3 $0.0 $0.1 $92.4

Return to top of page

Sources: State Energy Price and Expenditure Report. Energy Information Administration, Washington, DC. Nebraska Department of Enivironment and Energy, Lincoln, NE.

Notes: There are no direct fuel costs for hydroelectric, geothermal, wind, photovoltaic, or solar thermal energy. Totals may not equal the sum of the components due to independent rounding.

1 Other petroleum is the subtotal of sixteen (16) petroleum products consumed in the industrial sector.

The table and graph were updated on January 9, 2024.
Typically, there are one to two years between updates.

Return to top of page