Nebraska Department of Environment and Energy

Air Water Land Energy

Nebraska Energy Statistics

Energy Consumption in
Nebraska's Industrial Sector

The industrial sector consists of manufacturing, construction, mining, agriculture, and forestry organizations. Energy used by this sector to transport products to market or inputs to the organizations is included in the transportation sector.

For the residential, commercial, and industrial sectors, a net total or net energy consumption (less electrical system energy losses) is provided to indicate the energy actually consumed by these sectors. In addition, energy consumed in the generation, transmission, and distribution of electricity (electrical system energy losses) is allocated to each sector based on the electricity consumed by the sector. Thus, total energy consumption represents the energy consumed by the sector as well as that used to provide electricity to the sector.

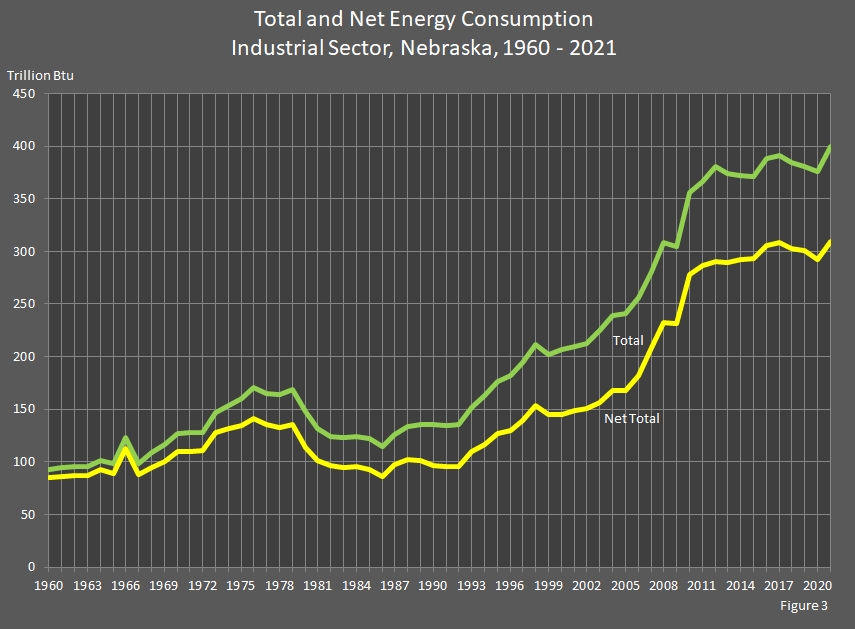
Between 2020 and 2021, industrial sector net energy use increased 5.6 percent to 309.1 trillion British thermal units (Btu). Total energy consumption attributed to the industrial sector in 2021 was 400.0 trillion Btu, an increase of 6.5 percent from 2020. Renewable energy use increased 12.2 percent, coal use increased 12.1 percent, electricity use increased 8.8 percent, natural gas use increased 1.2 percent from 2020. Petroleum use decreased 3.7 percent. Renewable energy consumption was comprised of biofuels, solar, and wood and waste.

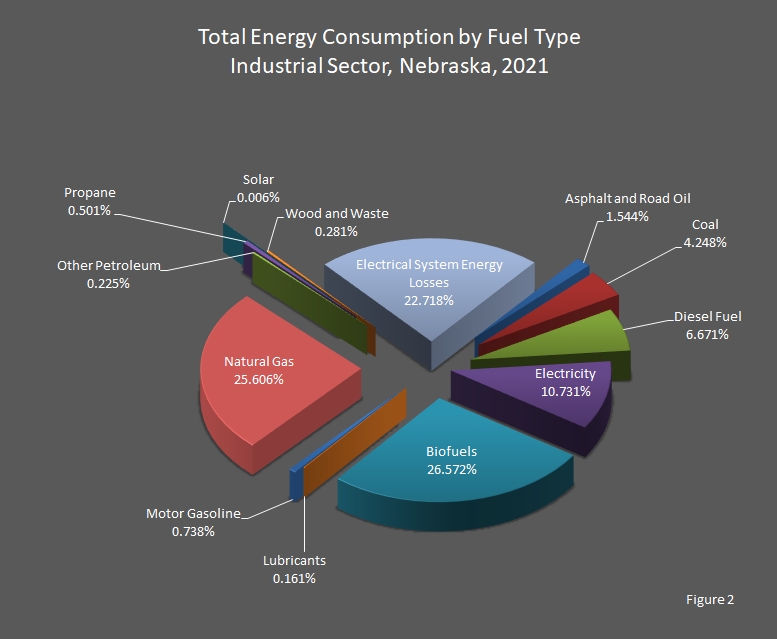
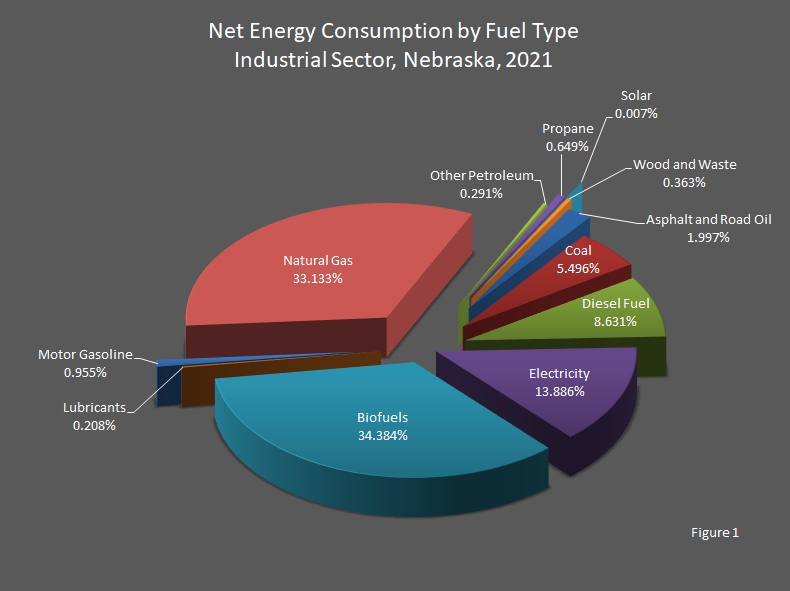
In 2021, almost all (94.0%) of the industrial sector energy needs were met by natural gas (33.1 percent), renewable energy (34.8 percent), electricity (13.9 percent), and petroleum products (12.1 percent). Five–and–five–tenths percent (5.5%) of the energy consumed in the industrial sector was coal. The majority of the petroleum products consumed by the industrial sector were diesel fuel (71.4 percent of petroleum products), asphalt and road oil (16.5 percent), motor gasoline (7.9 percent), and propane (5.4 percent); the rest of the products each comprised less than three percent of petroleum products.

Other petroleum products include sixteen (16) separate products, all of which are assigned to the industrial sector. The sixteen products are:

  1. aviation gasoline blending components;
  2. crude oil;
  3. motor gasoline blending components;
  4. natural gasoline, including isopentane;
  5. pentanes plus;
  6. petrochemical feedstocks, naphtha;
  7. petrochemical feedstocks, other oils;
  8. petrochemical feedstocks, still gas;
  9. petroleum coke;
  10. plant condensate;
  11. special naphthas;
  12. still gas;
  13. unfinished oils;
  14. unfractionated streams;
  15. waxes; and
  16. miscellaneous.
    • Miscellaneous products vary from inexpensive (absorption oils similar to kerosene) to very expensive (hydraulic fluids) products. The greater part of the miscellaneous product line consists of finished petrochemicals, especially the aromatic hydrocarbons:  benzene, toluene, and the xylenes.
Return to top of page

chart showing Net Energy Consumption by Fuel Type in the Industrial Sector in Nebraska.

Return to top of page

chart showing Total Energy Consumption by Fuel Type in the Industrial Sector in Nebraska.

Return to top of page

chart showing Total and Net Energy Consumption by Fuel Type in the Industrial Sector.

Return to top of page

Energy Consumption by Fuel Type,
Industrial Sector
Nebraska, 2020 – 2021

[Trillion British Thermal Units (Btu)]

Year Coal Electricity Natural
Gas
Petroleum Renewable Net
Energy
Consumption
Electrical
System
Energy
Losses
Total
Energy
Consumption
Asphalt
and
Road Oil
Diesel
Fuel
Kero­sene Lubri­cants Motor
Gasoline
Other
Petroleum1
Propane Residual
Fuel
Biofuels Photovoltaic and Solar Thermal Wood
and Waste
2021 17.001 42.952 102.488 6.178 26.699 0.002 0.643 2.953 0.889 2.007 0.000 106.356 1.023 1.123 309.110 90.931 400.041
2020 15.160 39.464 101.299 6.252 28.104 0.003 0.562 3.011 0.884 2.129 0.000 94.732 0.009 1.102 292.679 82.910 375.589

Return to top of page

Energy Consumption by Fuel Type,
Industrial Sector
Nebraska, 2000 – 2019

[Trillion British Thermal Units (Btu)]

Year Coal Electricity Natural
Gas
Petroleum Renewable Net
Energy
Consumption
Electrical
System
Energy
Losses
Total
Energy
Consumption
Asphalt
and
Road Oil
Diesel
Fuel
Kero­sene Lubri­cants Motor
Gasoline
Other
Petroleum1
Propane Residual
Fuel
Biofuels Photovoltaic and Solar Thermal Wood
and Waste
2019 17.520 36.230 96.020 5.120 26.590 0.000 0.580 2.970 0.940 2.410 0.000 111.200 0.008 1.010 300.550 80.350 380.890
2018 20.330 37.440 94.970 5.700 25.510 0.000 0.560 3.120 1.030 2.390 0.000 106.770 0.005 0.920 298.500 81.760 380.260
2017 21.022 38.889 95.054 6.466 27.988 0.002 0.552 3.072 0.644 3.148 0.000 112.579 0.002 0.681 309.639 82.742 392.381
2016 20.013 38.058 96.470 5.803 28.160 0.004 0.598 3.059 0.634 2.903 0.000 105.991 0.001 0.791 302.443 82.155 384.598
2015 21.175 36.355 90.533 6.325 26.400 0.002 0.216 3.332 0.626 2.069 0.000 101.029 0.001 0.434 288.499 78.436 366.935
2014 21.971 36.401 90.401 6.167 25.971 0.003 0.198 2.248 0.623 2.590 0.002 95.758 0.001 0.367 282.701 79.678 362.379
2013 20.297 38.390 91.538 6.120 27.920 0.002 0.190 2.635 0.597 3.686 0.000 97.166 0.001 0.380 288.921 84.760 373.681
2012 18.917 40.654 87.245 7.560 31.779 0.002 0.179 2.734 0.212 3.185 0.000 98.069 0.001 0.334 290.870 90.339 381.209
2011 19.045 36.132 87.365 6.746 23.846 0.004 0.195 3.104 0.213 2.502 0.000 107.313 0.000 0.355 286.820 80.176 366.996
2010 12.741 34.838 85.848 7.570 24.235 0.006 0.205 3.064 0.219 2.879 0.000 96.814 0.000 4.189 272.610 78.093 350.703
2009 7.266 32.451 82.220 7.274 25.974 0.020 0.185 2.361 0.188 4.969 0.001 64.894 0.000 4.088 231.892 72.943 304.835
2008 7.805 32.837 77.501 5.378 33.774 0.005 0.206 2.249 0.216 3.166 0.241 65.686 0.000 3.731 232.795 75.624 308.419
2007 8.085 31.064 67.019 5.996 35.357 0.010 0.221 3.612 0.224 5.417 0.295 47.301 0.000 3.790 208.391 72.220 280.611
2006 8.155 30.630 54.241 6.985 29.987 0.017 0.214 6.545 0.248 7.403 0.218 34.707 0.000 3.351 182.703 70.364 253.066
2005 7.824 30.089 41.583 8.068 30.384 0.042 0.220 6.405 0.203 6.198 0.645 31.680 0.000 4.795 168.138 69.250 237.388
2004 7.450 29.405 39.533 8.636 32.134 0.054 0.221 6.598 0.200 7.580 1.134 30.592 0.000 4.534 168.071 67.266 235.337
2003 7.796 28.734 38.681 8.868 30.856 0.045 0.218 5.483 0.208 7.386 0.798 23.076 0.000 4.575 156.724 64.786 221.510
2002 7.960 25.807 41.059 5.331 29.177 0.012 0.236 5.230 0.217 9.146 0.777 21.565 0.000 4.744 151.261 58.293 209.554
2001 10.136 25.002 40.848 5.682 30.085 0.043 0.239 4.860 0.232 5.913 0.663 21.550 0.000 4.173 149.428 57.031 206.459
2000 8.350 24.826 46.932 6.217 26.445 0.036 0.261 3.222 0.106 6.204 0.725 19.718 0.000 2.121 145.162 57.852 203.014

Return to top of page

Energy Consumption by Fuel Type,
Industrial Sector
Nebraska, 1980 – 1999

[Trillion British Thermal Units (Btu)]

Year Coal Electricity Natural
Gas
Petroleum Renewable Net
Energy
Consumption
Electrical
System
Energy
Losses
Total
Energy
Consumption
Asphalt
and
Road Oil
Diesel
Fuel
Kero­sene Lubri­cants Motor
Gasoline
Other
Petroleum1
Propane Residual
Fuel
Losses
and
Co–products
Photovoltaic and Solar Thermal Wood
and Waste
1999 7.722 23.486 45.712 12.387 24.425 0.021 0.265 3.507 0.120 5.813 0.437 18.785 0.000 2.683 145.363 54.114 199.478
1998 7.333 23.596 53.234 9.288 29.240 0.060 0.262 5.370 0.136 4.652 0.616 17.719 0.000 2.652 154.159 54.717 208.875
1997 5.670 22.449 44.317 9.623 27.332 0.078 0.250 4.155 0.140 5.591 0.632 16.682 0.000 2.742 139.684 52.068 191.730
1996 5.391 21.131 36.332 11.755 26.796 0.065 0.237 3.975 0.156 6.952 1.052 12.453 0.000 3.497 129.792 49.192 178.984
1995 6.563 19.795 43.898 6.164 27.631 0.051 0.244 3.874 0.169 5.775 0.756 12.144 0.000 0.005 127.069 46.248 173.318
1994 7.909 18.237 36.222 6.841 31.185 0.058 0.249 3.763 0.169 6.187 1.212 5.097 0.000 0.005 117.133 43.174 160.307
1993 6.832 16.932 37.495 5.291 28.769 0.053 0.238 3.534 0.167 5.525 1.608 3.418 0.000 0.000 109.862 39.862 149.724
1992 5.996 16.215 25.578 5.960 28.404 0.046 0.234 4.175 0.155 6.115 0.907 1.647 0.000 0.000 95.591 37.973 133.563
1991 6.129 16.002 23.981 9.410 27.043 0.053 0.229 4.786 0.146 5.897 1.064 1.003 0.000 0.000 95.897 37.176 133.073
1990 4.477 15.757 24.799 9.213 28.019 0.080 0.256 4.862 0.561 6.063 1.483 0.965 0.000 0.000 96.663 37.158 133.821
1989 5.337 14.911 29.649 7.501 27.116 0.061 0.249 5.408 0.577 7.764 1.691 0.954 0.000 0.000 101.374 34.424 135.797
1988 5.018 14.002 31.284 8.375 26.693 0.328 0.243 5.463 0.594 7.364 2.026 0.908 0.000 0.000 102.424 31.002 133.425
1987 5.807 13.139 29.025 8.238 24.88 0.491 0.252 6.415 0.553 6.255 1.294 0.924 0.000 0.000 97.416 29.080 126.496
1986 6.250 12.82 19.882 6.332 26.144 0.803 0.223 6.137 0.524 4.903 1.253 0.821 0.000 0.000 86.202 28.761 114.963
1985 4.857 12.944 31.905 3.141 25.959 0.123 0.228 7.190 0.417 4.819 0.387 0.705 0.000 0.024 92.823 29.647 122.470
1984 5.429 12.710 37.183 4.191 25.402 0.138 0.244 4.962 0.407 4.060 0.437 0.087 0.000 0.024 95.361 28.985 124.346
1983 4.257 12.505 36.112 4.434 20.681 0.131 0.229 5.656 0.411 9.230 0.655 0.090 0.000 0.024 94.505 29.408 123.913
1982 6.121 11.812 36.362 4.887 19.526 0.284 0.219 6.282 0.378 10.417 0.564 0.049 0.000 0.021 96.971 27.929 124.900
1981 7.020 13.242 41.631 4.450 17.869 0.272 0.24 7.103 0.880 8.160 0.230 0.022 0.000 0.022 101.163 31.008 132.171
1980 5.163 14.177 50.909 4.768 19.867 0.176 0.250 7.729 0.756 9.717 0.182 0.000 0.000 0.020 113.715 34.057 147.773

Return to top of page

Energy Consumption by Fuel Type,
Industrial Sector
Nebraska, 1960 – 1979

[Trillion British Thermal Units (Btu)]

Year Coal Electricity Natural
Gas
Petroleum Renewable Net
Energy
Consumption
Electrical
System
Energy
Losses
Total
Energy
Consumption
Asphalt
and
Road Oil
Diesel
Fuel
Kero­sene Lubri­cants Motor
Gasoline
Other
Petroleum1
Propane Residual
Fuel
Losses
and
Co–products
Photovoltaic and Solar Thermal Wood
and Waste
1979 10.123 13.918 51.806 5.422 32.468 0.147 0.281 8.211 0.777 10.293 0.249 0.000 0.000 2.391 136.084 33.222 169.307
1978 10.688 12.911 52.347 10.66 26.549 0.638 0.268 8.466 0.854 6.606 0.814 0.000 0.000 2.356 133.159 31.265 164.424
1977 10.527 12.279 61.086 7.286 22.308 0.627 0.250 8.570 0.858 8.606 1.149 0.000 0.000 1.961 135.506 29.349 164.856
1976 11.615 12.085 64.706 3.785 25.906 0.706 1.301 8.444 0.904 9.272 1.015 0.000 0.000 1.806 141.545 28.919 170.464
1975 5.934 10.918 73.504 5.003 18.838 0.629 1.171 8.638 0.881 6.603 0.861 0.000 0.000 1.548 134.527 26.188 160.715
1974 6.393 8.890 72.052 6.473 19.300 0.753 1.153 8.464 0.876 5.353 0.917 0.000 0.000 1.531 132.156 21.498 153.654
1973 6.294 7.882 73.726 5.867 20.450 0.809 1.204 3.692 0.914 4.505 0.919 0.000 0.000 1.600 127.862 18.704 146.566
1972 4.385 7.171 57.624 5.901 20.646 0.78 0.835 6.521 0.851 3.996 1.016 0.000 0.000 1.531 111.26 17.169 128.429
1971 3.909 7.484 57.11 7.373 19.273 0.810 0.780 7.879 0.806 3.032 0.722 0.000 0.000 0.550 109.731 18.046 127.777
1970 4.926 7.319 56.892 7.545 19.054 0.739 0.972 6.931 0.615 3.075 0.871 0.000 0.000 0.516 109.457 17.705 127.162
1969 3.680 6.842 52.085 4.916 17.000 0.536 0.954 8.392 0.657 3.516 1.081 0.000 0.000 0.499 100.159 16.321 116.480
1968 3.415 5.948 49.547 5.225 17.431 0.643 0.895 7.906 0.484 2.395 0.608 0.000 0.000 0.499 94.998 14.190 109.188
1967 5.448 4.266 43.490 4.019 16.373 1.345 0.815 9.221 0.321 2.145 0.383 0.000 0.000 0.499 88.329 10.190 98.519
1966 8.537 4.271 64.737 4.737 15.617 1.763 0.818 8.931 0.260 2.099 0.430 0.000 0.000 0.516 112.720 10.235 122.955
1965 7.593 4.032 47.717 4.349 11.392 1.420 0.787 9.402 0.297 1.302 0.201 0.000 0.000 0.499 88.993 9.624 98.618
1964 9.777 3.734 46.524 4.337 13.975 1.219 0.577 10.031 0.269 1.584 0.266 0.000 0.000 0.482 92.779 8.873 101.652
1963 10.912 3.546 40.587 5.596 12.208 1.047 0.549 9.873 0.279 1.912 0.354 0.000 0.000 0.464 87.332 8.476 95.807
1962 10.265 3.34 41.95 4.676 12.156 1.184 0.549 10.975 0.360 1.295 0.235 0.000 0.000 0.430 87.421 8.023 95.444
1961 9.855 3.196 38.679 4.659 14.407 1.352 0.571 11.537 0.360 1.468 0.084 0.000 0.000 0.413 86.586 7.768 94.354
1960 8.961 3.032 38.274 5.177 14.012 1.560 0.587 11.271 0.369 1.838 0.113 0.000 0.000 0.396 85.592 7.498 93.090

Return to top of page

Sources: State Energy Data Report. Energy Information Administration, Washington, DC. Nebraska Department of Environment and Energy, Lincoln, NE.

Note: Totals may not equal the sum of the components due to independent rounding.

1 Other petroleum includes the subtotal of sixteen (16) petroleum products consumed in the industrial sector.

The table and graphs were updated on January 9, 2024.
Typically, there are one to two years between updates.

Return to top of page