Nebraska Department of Environment and Energy

Air Water Land Energy

Nebraska Energy Statistics

Energy Prices in
Nebraska's Commercial Sector

The commercial sector consists of nonmanufacturing business establishments. Included are hotels, motels, restaurants, wholesale businesses, retail stores, laundries, and other service enterprises; health, social, and educational institutions; and federal, state, and local governments. Streetlights, pumps, bridges, and public services are also included. Fuel used in motor vehicles for commercial purposes is included in the transportation sector.

Examples of common uses of energy in the commercial sector include space heating, water heating, refrigeration, air conditioning, and cooking.

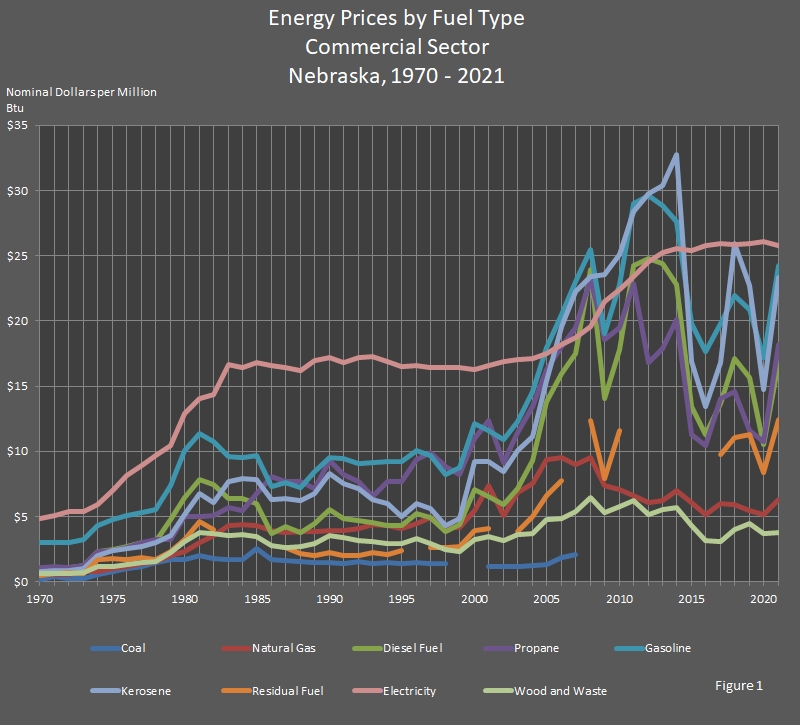
Using an equivalent measure of million British thermal units (Btu), the graph below compares the prices of fuel. The prices are also in nominal dollars to provide a better comparison.

In 2021, the highest price was for electricity at $25.81 per million Btu followed by motor gasoline at $24.22, kerosene at $23.30, propane at $18.18, and diesel fuel at $16.81. Residual fuel was $12.47, natural gas was $6.29, and wood and waste was $3.77. If any fuel had consumption low enough to round to zero, the price is shown as $0.

The price for ethanol is not tracked, and there are no direct fuel costs for hydroelectric, geothermal, wind, photovoltaic, or solar thermal energy, so no prices are reported.

Return to top of page

chart showing Energy Prices by Fuel Type in the Commercial Sector in Nebraska.

Return to top of page

Energy Prices by Fuel Type,
Commercial Sector
Nebraska, 2010 – 2021

[Nominal Dollars per Million British Thermal Units (Btu)]

Year Coal Electricity Natural
Gas
Petroleum Renewable Annual
Average
Diesel
Fuel
Kerosene Motor
Gasoline
Propane Residual
Fuel
Wood and
Waste
2021 $0.00 $25.81 $6.29 $16.81 $23.30 $24.22 $18.18 $12.47 $3.77 $15.97
2020 $0.00 $26.05 $5.12 $10.55 $14.75 $17.15 $10.72 $8.34 $3.71 $14.91
2019 $0.00 $25.94 $5.45 $15.62 $22.72 $20.90 $11.60 $11.27 $4.46 $14.96
2018 $0.00 $25.87 $5.92 $17.09 $25.95 $21.93 $14.56 $11.07 $4.03 $15.37
2017 $0.00 $25.93 $6.00 $13.69 $16.84 $19.78 $14.04 $9.75 $3.04 $16.07
2016 $0.00 $25.79 $5.15 $11.26 $13.46 $17.62 $10.46 $0.00 $3.17 $15.82
2015 $0.00 $25.42 $6.06 $13.45 $16.89 $19.80 $20.14 $0.00 $4.55 $15.87
2014 $0.00 $25.58 $6.98 $22.74 $32.72 $27.59 $23.15 $15.88 $5.60 $16.36
2013 $0.00 $25.21 $6.26 $24.39 $30.40 $28.85 $20.60 $0.00 $5.56 $15.86
2012 $0.00 $24.57 $6.08 $24.76 $29.74 $29.59 $19.33 $16.83 $5.15 $16.26
2011 $0.00 $23.40 $6.62 $24.20 $28.35 $28.96 $21.65 $0.00 $6.24 $15.11
2010 $0.00 $22.38 $7.05 $17.83 $25.05 $22.74 $19.51 $11.60 $5.73 $14.86

Return to top of page

Energy Prices by Fuel Type,
Commercial Sector
Nebraska, 1990 – 2009

[Nominal Dollars per Million British Thermal Units (Btu)]

Year Coal Electricity Natural
Gas
Petroleum Renewable Annual
Average
Diesel
Fuel
Kerosene Motor
Gasoline
Propane Residual
Fuel
Wood and
Waste
2009 $0.00 $21.49 $7.35 $14.06 $23.58 $19.00 $18.57 $7.94 $5.27 $14.40
2008 $0.00 $19.59 $9.51 $23.92 $23.36 $25.38 $23.22 $12.35 $6.47 $14.68
2007 $2.10 $18.73 $9.00 $17.50 $22.22 $22.94 $19.50 $0.00 $5.39 $14.11
2006 $1.89 $18.15 $9.50 $15.93 $19.59 $20.49 $18.05 $7.75 $4.83 $14.03
2005 $1.28 $17.52 $9.36 $13.78 $15.41 $17.92 $16.26 $6.62 $4.75 $13.59
2004 $1.21 $17.13 $7.53 $9.27 $11.15 $14.58 $13.46 $5.03 $3.73 $12.15
2003 $1.13 $17.03 $6.85 $7.13 $10.04 $12.24 $11.46 $3.87 $3.63 $11.83
2002 $1.15 $16.89 $5.07 $5.90 $8.45 $10.88 $9.16 $0.00 $3.15 $11.13
2001 $1.14 $16.58 $7.35 $6.52 $9.19 $11.58 $12.38 $4.05 $3.43 $11.89
2000 $0.00 $16.27 $5.44 $7.05 $9.18 $12.07 $10.97 $3.93 $3.24 $10.84
1999 $0.00 $16.44 $4.15 $4.35 $4.88 $8.72 $8.25 $2.69 $2.31 $10.08
1998 $1.42 $16.41 $4.24 $3.83 $4.31 $8.19 $8.82 $2.64 $2.45 $9.98
1997 $1.42 $16.41 $4.89 $4.92 $5.62 $9.62 $9.88 $2.65 $2.94 $9.70
1996 $1.45 $16.60 $4.44 $5.24 $6.00 $10.02 $9.35 $0.00 $3.32 $9.04
1995 $1.42 $16.46 $4.05 $4.30 $4.97 $9.21 $7.71 $2.38 $2.90 $8.84
1994 $1.46 $16.88 $4.30 $4.29 $6.00 $9.21 $7.71 $2.08 $2.96 $9.00
1993 $1.43 $17.28 $4.38 $4.50 $6.28 $9.11 $6.50 $2.27 $3.05 $9.29
1992 $1.57 $17.15 $4.08 $4.68 $7.13 $9.09 $7.67 $1.97 $3.12 $9.05
1991 $1.43 $16.84 $3.93 $4.88 $7.52 $9.43 $8.25 $2.03 $3.41 $8.58
1990 $1.48 $17.21 $3.92 $5.50 $8.28 $9.49 $9.29 $2.22 $3.56 $8.85

Return to top of page

Energy Prices by Fuel Type,
Commercial Sector
Nebraska, 1970 – 1989

[Nominal Dollars per Million British Thermal Units (Btu)]

Year Coal Electricity Natural
Gas
Petroleum Renewable Annual
Average
Diesel
Fuel
Kerosene Motor
Gasoline
Propane Residual
Fuel
Wood and
Waste
1989 $1.47 $16.93 $3.82 $4.44 $6.78 $8.42 $7.12 $2.02 $2.95 $8.56
1988 $1.57 $16.22 $3.81 $3.80 $6.26 $7.22 $7.65 $2.13 $2.67 $8.04
1987 $1.62 $16.43 $3.76 $4.21 $6.38 $7.58 $7.70 $2.60 $2.65 $8.32
1986 $1.67 $16.55 $3.95 $3.67 $6.29 $7.28 $8.10 $0.00 $2.78 $8.22
1985 $2.51 $16.78 $4.29 $6.00 $7.81 $9.67 $6.73 $0.00 $3.46 $8.27
1984 $1.70 $16.44 $4.35 $6.34 $7.89 $9.55 $5.43 $0.00 $3.60 $7.90
1983 $1.67 $16.66 $4.29 $6.37 $7.70 $9.61 $5.66 $0.00 $3.54 $7.80
1982 $1.79 $14.32 $3.56 $7.46 $6.06 $10.71 $5.10 $4.03 $3.66 $6.51
1981 $1.97 $14.06 $3.02 $7.80 $6.74 $11.37 $4.97 $4.64 $3.77 $6.21
1980 $1.69 $12.86 $2.33 $6.49 $5.17 $10.06 $4.97 $3.22 $3.06 $5.00
1979 $1.72 $10.43 $2.01 $4.80 $3.53 $7.41 $3.21 $2.33 $2.20 $4.04
1978 $1.47 $9.66 $1.54 $3.07 $3.00 $5.50 $3.21 $1.68 $1.54 $3.51
1977 $1.17 $8.94 $1.39 $3.01 $2.73 $5.29 $3.03 $1.83 $1.45 $3.06
1976 $1.03 $8.16 $1.16 $2.67 $2.57 $5.06 $2.59 $1.73 $1.28 $2.63
1975 $0.81 $6.96 $1.00 $2.45 $2.39 $4.76 $2.38 $1.75 $1.20 $2.36
1974 $0.57 $5.94 $0.81 $2.29 $2.00 $4.27 $2.34 $1.67 $1.14 $2.03
1973 $0.24 $5.39 $0.75 $1.24 $1.01 $3.21 $1.25 $0.66 $0.74 $1.88
1972 $0.22 $5.37 $0.57 $1.12 $0.85 $3.00 $1.12 $0.72 $0.64 $1.57
1971 $0.41 $5.08 $0.58 $1.11 $0.85 $3.00 $1.16 $0.59 $0.64 $1.51
1970 $0.16 $4.87 $0.52 $1.03 $0.79 $3.03 $1.07 $0.50 $0.60 $1.37

Return to top of page

Sources: State Energy Price and Expenditure Report. Energy Information Administration, Washington, DC. Nebraska Department of Environment and Energy, Lincoln, NE.

Note: The average column contains the average price of all commercial sector energy sources for each year.

The table and graph were updated on January 9, 2024.
Typically, there are one to two years between updates.

Return to top of page