Nebraska Department of Environment and Energy

Air Water Land Energy

Nebraska Energy Statistics

Energy Consumption
in Nebraska's Commercial Sector

The commercial sector consists of non-manufacturing business establishments. Included are hotels, motels, restaurants, wholesale businesses, retail stores, laundries, and other service enterprises; health, social, and educational institutions; and federal, state, and local governments. Streetlights, pumps, bridges, and public services are also included. Fuel used in motor vehicles for commercial purposes is included in the transportation sector. Examples of common uses of energy in the commercial sector include space heating, water heating, refrigeration, air conditioning, and cooking.

For the residential, commercial, and industrial sectors, a net total or net energy consumption (less electrical system energy losses) is provided to indicate the energy actually consumed by these sectors. In addition, energy consumed in the generation, transmission, and distribution of electricity (electrical system energy losses) is allocated to each sector based on the electricity consumed by the sector. Thus, total energy consumption represents the energy consumed by the sector as well as that used to provide electricity to the sector.

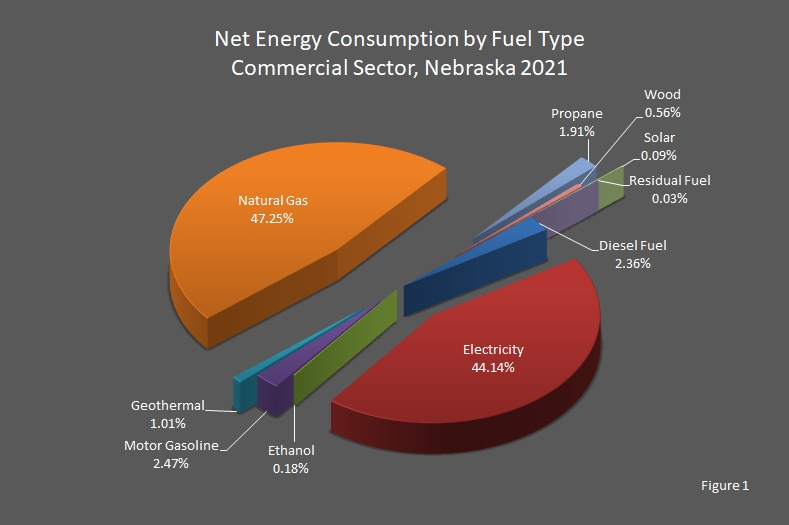
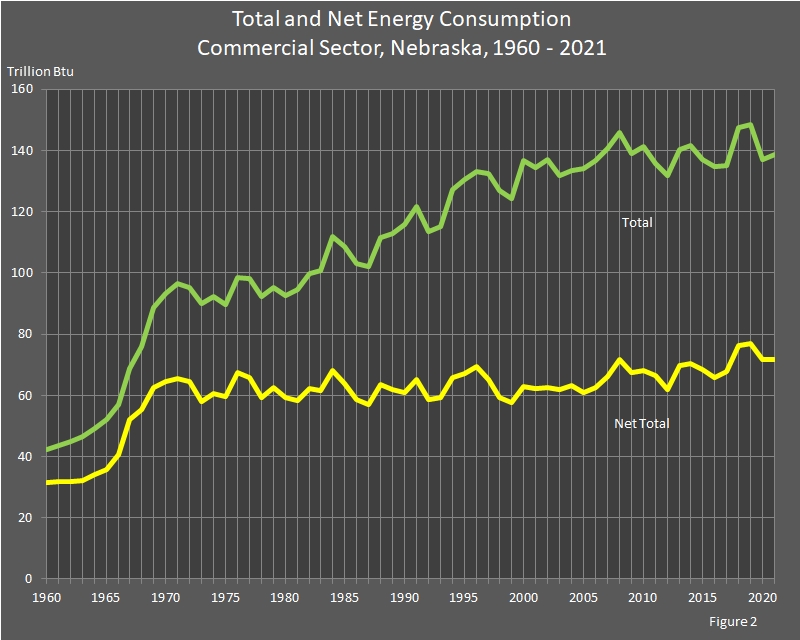
From 2020 to 2021, commercial sector net energy use decreased 0.2 percent to 71.7 trillion British thermal units (Btu). Total energy use in the sector increased 1.2 percent to 138.6 trillion Btu. Petroleum use decreased 14.3 percent although it comprises only 6.8 percent of the energy used by the commercial sector. Renewable energy use increased 1.3 percent from 2020. Electricity use increased 1.9 percent, and natural gas use increased 0.3 percent from 2020. Residual fuel increased 26.3 percent, but only comprises 0.03 percent of the energy used by the commercial sector. Residual fuel consumption was small enough to round to zero in this table for the years 1983–1986, 1996, 2002, 2007, 2010–2013, and 2015, and 2016. Coal consumption was small enough to round to zero in this table for the years 1998–2000, and 2008–2021.

In 2021, nearly all (91.4 percent) of the commercial sector's energy needs were met by electricity and natural gas. Petroleum products made up 6.8 percent of the energy consumed in the commercial sector, and 1.8 percent was renewable energy. Each of the other fuels made up less than one percent of the energy consumed.
Return to top of page

pie chart graphic displaying Net Energy Consumption by fuel type, by commercial sector, in Nebraska

Return to top of page

line chart displaying Total and Net Energy Consumption in Nebraska.

Return to top of page

Energy Consumption by Fuel Type, Commercial Sector, Nebraska,
2020 – 2021

[Trillion British Thermal Units (Btu)]

Year Coal Electricity Natural
Gas
Petroleum Renewable Net
Energy
Consumption
Electrical
System
Energy
Losses
Total
Energy
Consumption
Diesel
Fuel
Kerosene Motor
Gasoline
Propane Residual
Fuel
Ethanol Geothermal Photovoltaic and Solar Thermal Wood
2021 0.000 31.597 33.824 1.690 0.001 1.768 1.365 0.024 0.126 0.720 0.068 0.399 71.706 66.892 138.598
2020 0.000 31.016 33.715 2.165 0.003 1.740 1.728 0.019 0.123 0.720 0.067 0.394 71.829 65.161 136.990

Return to top of page

Energy Consumption by Fuel Type, Commercial Sector, Nebraska,
2000 – 2019

[Trillion British Thermal Units (Btu)]

Year Coal Electricity Natural
Gas
Petroleum Renewable Net
Energy
Consumption
Electrical
System
Energy
Losses
Total
Energy
Consumption
Diesel
Fuel
Kerosene Motor
Gasoline
Propane Residual
Fuel
Ethanol Geothermal Photovoltaic and Solar Thermal Wood
2019 0.000 32.266 37.854 2.440 0.002 1.726 0.988 0.021 0.123 0.720 0.045 0.446 76.772 71.557 148.329
2018 0.000 32.596 37.471 2.261 0.001 1.721 0.864 0.038 0.120 0.720 0.036 0.421 76.311 71.177 147.488
2017 0.000 31.709 30.783 1.818 0.001 1.696 0.459 0.009 0.120 0.720 0.017 0.335 67.732 67.466 135.198
2016 0.000 31.755 28.596 1.934 0.002 1.824 0.427 0.000 0.127 0.720 0.008 0.397 65.949 68.548 134.497
2015 0.000 31.758 31.134 1.875 0.001 1.843 0.535 0.000 0.129 0.720 0.003 0.396 68.558 68.518 137.076
2014 0.000 32.501 33.696 1.892 0.002 0.311 0.692 0.007 0.020 0.720 0.003 0.362 70.394 71.142 141.536
2013 0.000 32.029 33.382 1.873 0.001 0.281 0.887 0.000 0.016 0.720 0.003 0.353 69.729 70.715 140.444
2012 0.000 31.503 27.002 1.188 0.001 0.356 0.541 0.001 0.021 0.720 0.002 0.305 61.840 70.004 131.844
2011 0.000 31.184 32.468 1.141 0.003 0.377 0.536 0.000 0.023 0.364 0.002 0.348 66.593 69.195 135.788
2010 0.000 32.525 32.119 1.419 0.004 0.107 0.689 0.003 0.006 0.851 0.001 0.361 68.206 72.908 141.114
2009 0.000 31.780 32.177 1.312 0.003 0.447 0.427 0.043 0.022 0.754 0.000 0.366 67.433 71.435 138.868
2008 0.000 32.214 35.198 1.707 0.005 0.516 0.503 0.266 0.025 0.662 0.000 0.380 71.625 74.191 145.815
2007 0.104 32.061 30.606 1.093 0.007 0.580 0.504 0.000 0.015 0.616 0.000 0.360 66.092 74.537 140.628
2006 0.109 30.727 28.432 1.096 0.015 0.564 0.258 0.259 0.008 0.580 0.000 0.339 62.525 70.585 133.110
2006 0.074 30.190 27.666 1.196 0.024 0.134 0.583 0.146 0.002 0.544 0.000 0.365 61.053 69.483 130.536
2004 0.065 29.006 30.136 1.057 0.037 1.026 0.547 0.308 0.029 0.463 0.000 0.510 63.337 66.354 129.691
2003 0.104 29.285 28.575 1.230 0.020 0.484 1.009 0.090 0.015 0.409 0.000 0.522 61.874 66.029 127.903
2002 0.128 31.191 28.419 0.538 0.012 0.640 0.642 0.000 0.018 0.299 0.000 0.501 62.462 70.456 132.918
2001 0.110 29.878 28.258 1.415 0.015 1.064 0.529 0.132 0.023 0.274 0.000 0.489 62.284 68.155 130.439
2000 0.000 29.777 28.959 1.151 0.006 1.418 0.567 0.052 0.038 0.246 0.000 0.466 62.860 69.388 132.249

Return to top of page

Energy Consumption by Fuel Type, Commercial Sector, Nebraska,
1980 – 1999

[Trillion British Thermal Units (Btu)]

Year Coal Electricity Natural
Gas
Petroleum Renewable Net
Energy
Consumption
Electrical
System
Energy
Losses
Total
Energy
Consumption
Diesel
Fuel
Kerosene Motor
Gasoline
Propane Residual
Fuel
Ethanol Geothermal Photovoltaic and Solar Thermal Wood
1999 0.000 27.286 27.546 1.273 0.008 0.106 0.557 0.018 0.002 0.246 0.000 0.436 57.598 62.870 120.470
1998 0.000 27.532 28.990 1.290 0.016 0.107 0.544 0.045 0.002 0.246 0.000 0.414 59.301 63.842 123.144
1997 1.821 27.344 33.742 0.960 0.015 0.107 0.411 0.059 0.002 0.185 0.000 0.474 65.222 63.421 128.644
1996 0.022 25.806 41.015 1.341 0.023 0.109 0.512 0.000 0.002 0.165 0.000 0.501 69.495 60.074 129.570
1995 0.159 25.570 39.214 0.941 0.023 0.109 0.381 0.004 0.002 0.128 0.000 0.483 67.013 59.742 126.756
1994 0.130 24.392 38.076 1.919 0.030 0.108 0.354 0.117 0.002 0.109 0.000 0.478 65.717 57.746 123.465
1993 0.089 22.384 33.650 1.786 0.025 0.107 0.380 0.119 0.003 0.089 0.000 0.499 59.131 52.698 111.830
1992 0.106 22.077 33.301 1.559 0.008 0.466 0.405 0.255 0.018 0.071 0.000 0.483 58.767 51.699 110.466
1991 0.204 23.124 38.976 1.063 0.015 0.511 0.399 0.166 0.016 0.053 0.000 0.458 65.002 53.722 118.724
1990 0.068 22.009 35.111 1.673 0.130 0.795 0.318 0.126 0.021 0.035 0.000 0.439 60.746 51.902 112.648
1989 0.084 22.086 36.214 1.545 0.016 0.642 0.393 0.270 0.019 0.016 0.000 0.480 61.784 50.988 112.772
1988 0.641 21.638 38.094 1.834 0.011 0.690 0.388 0.082 0.016 0.000 0.000 0.206 63.617 47.909 111.525
1987 0.064 20.320 32.990 2.270 0.024 0.713 0.397 0.002 0.016 0.000 0.000 0.187 56.999 44.975 101.974
1986 0.064 19.781 35.348 2.039 0.045 0.733 0.289 0.000 0.013 0.000 0.000 0.193 58.519 44.378 102.897
1985 0.203 19.496 37.841 4.839 0.067 0.817 0.324 0.000 0.014 0.000 0.000 0.172 63.787 44.654 108.441
1984 1.565 19.253 40.337 5.951 0.045 0.492 0.249 0.000 0.009 0.000 0.000 0.157 68.066 43.904 111.971
1983 0.980 16.670 37.753 4.845 0.036 0.622 0.555 0.000 0.010 0.000 0.000 0.130 61.611 39.203 100.814
1982 0.431 15.918 42.184 1.737 0.079 0.681 0.467 0.636 0.005 0.000 0.000 0.140 62.283 37.636 99.919
1981 0.232 15.435 39.215 1.976 0.057 0.806 0.426 0.106 0.003 0.000 0.000 0.124 58.382 36.145 94.526
1980 0.271 13.880 42.495 1.053 0.119 0.781 0.457 0.144 0.000 0.000 0.000 0.142 59.343 33.344 92.687

Return to top of page

Energy Consumption by Fuel Type, Commercial Sector, Nebraska,
1960 – 1979

[Trillion British Thermal Units (Btu)]

Year Coal Electricity Natural
Gas
Petroleum Renewable Net
Energy
Consumption
Electrical
System
Energy
Losses
Total
Energy
Consumption
Diesel
Fuel
Kerosene Motor
Gasoline
Propane Residual
Fuel
Ethanol Geothermal Photovoltaic and Solar Thermal Wood
1979 0.882 13.696 43.393 2.664 0.028 0.736 0.464 0.678 0.000 0.000 0.000 0.029 62.570 32.693 95.263
1978 0.328 13.525 40.750 1.556 0.314 0.716 0.931 1.275 0.000 0.000 0.000 0.027 59.422 32.753 92.175
1977 0.211 13.500 47.027 1.333 0.410 0.681 0.913 1.689 0.000 0.000 0.000 0.027 65.790 32.268 98.058
1976 0.135 13.024 48.543 1.478 0.467 0.662 1.030 1.943 0.000 0.000 0.000 0.025 67.307 31.164 98.471
1975 0.117 12.488 42.966 1.014 0.405 0.630 1.021 0.997 0.000 0.000 0.000 0.023 59.662 29.955 89.617
1974 0.179 13.078 42.603 1.064 0.448 0.625 0.989 1.489 0.000 0.000 0.000 0.021 60.497 31.625 92.123
1973 0.280 13.501 39.170 1.229 0.585 0.634 1.143 1.297 0.000 0.000 0.000 0.020 57.858 32.039 89.896
1972 0.477 12.780 46.188 1.266 0.579 0.626 1.296 1.293 0.000 0.000 0.000 0.020 64.525 30.596 95.122
1971 0.343 12.864 47.639 1.107 0.491 0.597 1.217 1.338 0.000 0.000 0.000 0.019 65.616 31.019 96.635
1970 0.322 11.958 47.199 1.148 0.413 0.576 1.264 1.516 0.000 0.000 0.000 0.019 64.416 28.929 93.345
1969 0.640 11.016 45.949 0.862 0.394 0.567 1.234 1.807 0.000 0.000 0.000 0.021 62.488 26.278 88.766
1968 0.323 8.697 41.681 0.975 0.480 0.541 1.053 1.570 0.000 0.000 0.000 0.022 55.341 20.748 76.090
1967 0.299 6.946 41.277 0.957 0.101 0.513 0.958 1.009 0.000 0.000 0.000 0.023 52.083 16.590 68.673
1966 0.418 6.811 29.797 0.888 0.376 0.508 0.864 1.118 0.000 0.000 0.000 0.025 40.804 16.323 57.127
1965 0.542 6.910 25.276 0.652 0.494 0.496 0.827 0.530 0.000 0.000 0.000 0.026 35.753 16.495 52.248
1964 0.670 6.379 23.945 0.878 0.257 0.491 0.764 0.674 0.000 0.000 0.000 0.028 34.087 15.158 49.245
1963 0.943 5.938 22.227 0.762 0.249 0.482 0.853 0.722 0.000 0.000 0.000 0.031 32.208 14.195 46.403
1962 1.321 5.423 22.416 0.757 0.367 0.475 0.705 0.469 0.000 0.000 0.000 0.035 31.968 13.028 44.996
1961 1.263 4.806 23.200 0.842 0.350 0.462 0.630 0.230 0.000 0.000 0.000 0.038 31.820 11.679 43.499
1960 1.870 4.331 22.705 0.817 0.368 0.443 0.582 0.272 0.000 0.000 0.000 0.041 31.428 10.710 42.138

Return to top of page

Sources: State Energy Data Report. Energy Information Administration, Washington, DC. Nebraska Department of Environment and Energy, Lincoln, NE.

Note: Totals may not equal the sum of the components due to independent rounding.

The table and graphs were updated on January 9, 2024.
Typically, there are one to two years between updates.

Return to top of page