Nebraska Department of Environment and Energy

Air Water Land Energy

Nebraska Energy Statistics

Energy Prices in
Nebraska's Residential Sector

The residential sector consists of private households.  Energy is consumed primarily for space heating, water heating, air conditioning, refrigeration, cooking, clothes drying, and lighting.  Fuel used for motor vehicles by household members is included in the transportation sector.

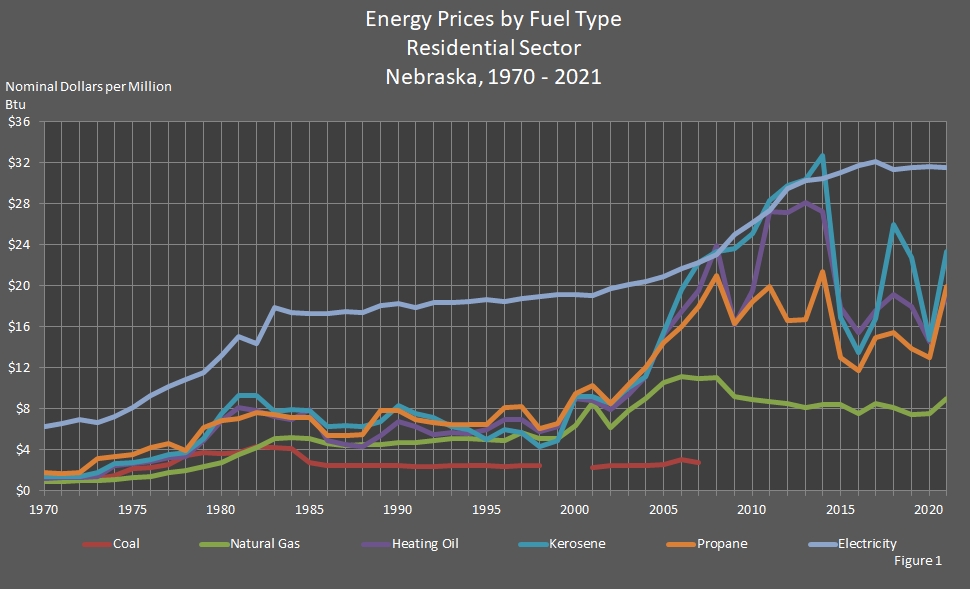
Using an equivalent measure of million British thermal units (Btu), the graph below compares the prices of fuel.  The prices are also in nominal dollars to provide a better comparison.  In 2021, the highest prices were for electricity at $31.51, kerosene at $23.30, heating oil at $19.11, and propane at $19.92 per million Btu.  The price of natural gas was $9.02.  Since the residential sector's coal consumption was small enough to round to zero for the years 1999, 2000, and 2008–2021, coal's price is shown as $0 for those years.

There are no direct fuel costs for hydroelectric, geothermal, wind, photovoltaic, or solar thermal energy, so no prices are reported.

Return to top of page

chart showing Energy Prices by Fuel Type in the Residential Sector in Nebraska.

Return to top of page

Energy Prices by Fuel Type, Residential Sector
Nebraska, 2010 – 2021

[Nominal Dollars per Million British Thermal Units (Btu)]

Year Coal Electricity Heating Oil Kerosene Natural Gas Propane Annual
Average
Year Coal Electricity Heating Oil Kerosene Natural Gas Propane Annual
Average
2021 $0.00 $31.51 $19.11 $23.30 $9.02 $19.92 $19.74
2020 $0.00 $31.64 $14.53 $14.75 $7.54 $12.98 $18.44
2019 $0.00 $31.55 $17.95 $22.72 $7.39 $13.82 $17.57
2018 $0.00 $31.37 $19.15 $25.95 $8.06 $15.44 $18.04
2017 $0.00 $32.15 $17.56 $16.84 $8.49 $14.97 $19.39
2016 $0.00 $31.77 $15.42 $13.46 $7.57 $11.75 $18.67
2015 $0.00 $31.07 $17.80 $16.89 $8.38 $20.64 $19.07
2014 $0.00 $30.48 $27.19 $32.72 $8.42 $28.22 $18.80
2013 $0.00 $30.23 $28.13 $30.40 $8.10 $24.64 $18.48
2012 $0.00 $29.44 $27.12 $29.74 $8.52 $22.86 $19.42
2011 $0.00 $27.32 $27.21 $28.35 $8.74 $23.69 $17.82
2010 $0.00 $26.20 $19.54 $25.05 $8.91 $18.47 $16.99

Return to top of page

Energy Prices by Fuel Type, Residential Sector
Nebraska, 1990 – 2009

[Nominal Dollars per Million British Thermal Units (Btu)]

Year Coal Electricity Heating Oil Kerosene Natural Gas Propane Annual
Average
Year Coal Electricity Heating Oil Kerosene Natural Gas Propane Annual
Average
2009 $0.00 $24.97 $16.18 $23.58 $9.23 $16.34 $16.20
2008 $0.00 $23.06 $23.95 $23.36 $10.99 $20.95 $16.75
2007 $2.72 $22.25 $19.56 $22.22 $10.95 $18.00 $16.24
2006 $3.00 $21.72 $17.46 $19.59 $11.16 $15.98 $16.01
2005 $2.52 $20.94 $15.23 $15.41 $10.58 $14.43 $15.12
2004 $2.47 $20.41 $11.10 $11.15 $8.97 $11.99 $13.64
2003 $2.42 $20.12 $9.36 $10.04 $7.77 $10.40 $12.55
2002 $2.41 $19.73 $7.88 $8.45 $6.13 $8.49 $11.27
2001 $2.25 $19.06 $8.81 $9.19 $8.57 $10.29 $12.29
2000 $0.00 $19.13 $9.03 $9.18 $6.40 $9.44 $11.21
1999 $0.00 $19.11 $6.24 $4.88 $5.07 $6.51 $10.18
1998 $2.43 $18.92 $5.80 $4.31 $5.12 $6.08 $10.18
1997 $2.40 $18.71 $6.90 $5.62 $5.70 $8.24 $10.20
1996 $2.35 $18.44 $6.92 $6.00 $4.84 $8.12 $9.36
1995 $2.44 $18.68 $5.92 $4.97 $4.94 $6.46 $9.66
1994 $2.47 $18.48 $5.57 $6.00 $5.09 $6.43 $9.61
1993 $2.44 $18.31 $5.65 $6.28 $5.09 $6.45 $9.29
1992 $2.39 $18.38 $5.51 $7.13 $4.92 $6.65 $9.30
1991 $2.36 $17.86 $6.25 $7.52 $4.71 $6.92 $9.07
1990 $2.42 $18.25 $6.74 $8.28 $4.68 $7.79 $9.33

Return to top of page

Energy Prices by Fuel Type, Residential Sector
Nebraska, 1970 – 1989

[Nominal Dollars per Million British Thermal Units (Btu)]

Year Coal Electricity Heating Oil Kerosene Natural Gas Propane Annual
Average
Year Coal Electricity Heating Oil Kerosene Natural Gas Propane Annual
Average
1989 $2.42 $18.05 $5.37 $6.78 $4.53 $7.82 $8.89
1988 $2.49 $17.42 $4.27 $6.26 $4.53 $5.48 $8.64
1987 $2.43 $17.52 $4.50 $6.38 $4.43 $5.35 $8.70
1986 $2.40 $17.27 $4.88 $6.29 $4.62 $5.34 $8.52
1985 $2.76 $17.30 $7.92 $7.81 $5.10 $7.12 $8.72
1984 $4.09 $17.35 $6.89 $7.89 $5.18 $7.18 $8.75
1983 $4.23 $17.88 $7.20 $7.70 $5.05 $7.46 $8.89
1982 $4.26 $14.34 $7.84 $9.24 $4.24 $7.66 $7.12
1981 $3.75 $15.07 $8.12 $9.24 $3.52 $7.08 $7.07
1980 $3.60 $13.22 $6.85 $7.55 $2.78 $6.82 $5.81
1979 $3.68 $11.52 $4.91 $5.09 $2.31 $6.17 $4.74
1978 $3.42 $10.81 $3.30 $3.69 $1.97 $3.87 $4.27
1977 $2.56 $10.20 $3.22 $3.48 $1.80 $4.60 $3.89
1976 $2.22 $9.32 $2.86 $3.04 $1.37 $4.18 $3.31
1975 $2.15 $8.13 $2.62 $2.74 $1.29 $3.57 $2.96
1974 $1.52 $7.22 $2.43 $2.63 $1.13 $3.33 $2.68
1973 $1.16 $6.60 $1.41 $1.73 $1.03 $3.10 $2.40
1972 $1.10 $6.92 $1.30 $1.40 $0.98 $1.78 $1.99
1971 $1.03 $6.52 $1.29 $1.39 $0.91 $1.68 $1.95
1970 $1.08 $6.21 $1.19 $1.39 $0.84 $1.75 $1.83

Return to top of page

Sources: State Energy Price and Expenditure Report. Energy Information Administration, Washington, DC. Nebraska Department of Environment and Energy, Lincoln, NE.

Note: The average column contains the average price of all residential sector energy sources for each year.

The table and graph were updated on January 9, 2024.
Typically, there are one to two years between updates.

Return to top of page