Nebraska Department of Environment and Energy

Air Water Land Energy

Nebraska Energy Statistics

Nebraska's Total Energy Expenditures
by Fuel Type

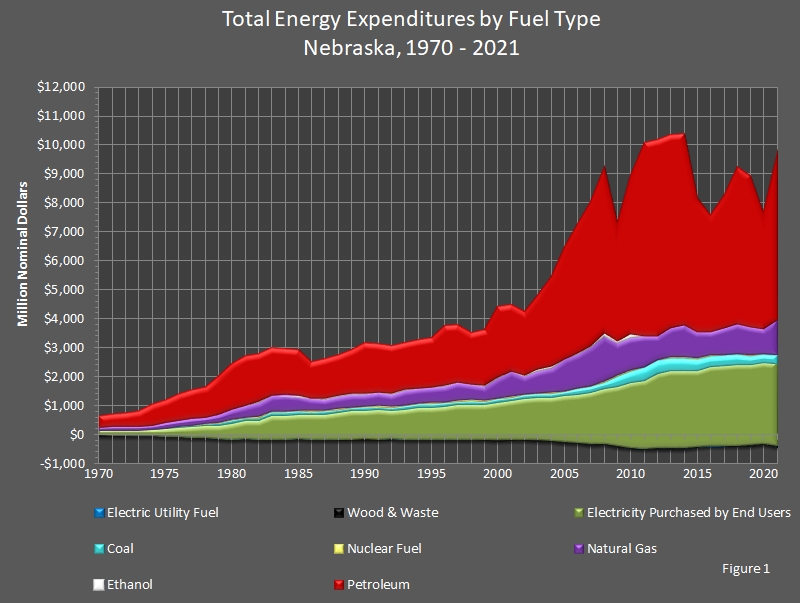
Nebraska's total expenditures on energy increased 26.6 percent to $9,665.8 million (or $9.7 billion) from 2020 to 2021. The first table below shows that, in 2021, $5,704.4 million (or $5.7 billion) was spent on petroleum, $1,203.0 million (or $1.2 billion) was spent on natural gas, $258.4 million was spent on coal, $43.9 million was spent on nuclear fuel, and $10.2 million was spent on renewable energy. Wood and waste make up the cost associated with renewable energy since there are no direct fuel costs for hydroelectric, geothermal, wind, photovoltaic, or solar thermal energy and expenditures on ethanol were not tracked.

Expenditures on petroleum were over half (59.0 percent) of Nebraska's total expenditures on energy in 2021. Twelve–and–five–tenths percent (12.5%) of Nebraska's expenditures was spent on natural gas, 2.7 percent was spent on coal, 0.45 percent was spent on nuclear fuel, and 0.11 percent was spent on renewable energy.

Petroleum is divided into ten fuels or categories of fuels, as shown in the second table below: motor gasoline made up 45.7 percent of petroleum, distillate fuel made up 44.4 percent of petroleum, propane (3.37 percent), lubricants (2.51 percent), asphalt and road oil (2.02 percent), jet fuel (1.54 percent), other petroleum (0.36 percent), aviation gasoline (0.09 percent), residual fuel (0.005 percent), and kerosene (0.004 percent).

Other petroleum includes sixteen (16) separate products, all of which are assigned to the industrial sector. The sixteen products are:

  1. aviation gasoline blending components;
  2. crude oil;
  3. motor gasoline blending components;
  4. natural gasoline, including isopentane;
  5. pentanes plus;
  6. petrochemical feedstocks, naphtha; petrochemical feedstocks, other oils; petrochemical feedstocks, still gas;
  7. petroleum coke;
  8. plant condensate;
  9. special naphthas;
  10. still gas;
  11. unfinished oils;
  12. unfractionated streams;
  13. waxes; and
  14. miscellaneous.
    • Miscellaneous products vary from inexpensive (absorption oils similar to kerosene) to very expensive (hydraulic fluids) products. The greater part of the miscellaneous product line consists of finished petrochemicals, especially the aromatic hydrocarbons: benzene, toluene, and the xylenes.

Petroleum products are listed in the second table below. The expenditures in both tables are in nominal dollars to provide a better comparison.

graphic representing the Total Energy Expenditures by Fuel Type in Nebraska.

Total Energy Expenditures by Fuel Type
Nebraska
1970 – 2021

(Million Nominal Dollars)

Year Primary Energy Resources Total
Primary
Energy
Expenditures
Electric
Utility
Fuel
Electricity
Purchased
by
End Users
Total
Energy
Expenditures
Coal Natural
Gas
Nuclear Fuel Petroleum Ethanol Wood and
Waste
2021 $258.4 $1,203.0 $43.9 $5,704.4 NA $10.2 $7,219.8 -$411.9 $2,857.9 $9,665.8
2020 $266.9 $867.6 $41.9 $3,974.3 NA $8.5 $5,159.2 -$319.2 $2,797.0 $7,637.0
2019 $299.3 $958.5 $49.8 $5,184.1 NA $12.6 $6,504.4 -$368.3 $2,759.2 $8,895.3
2018 $339.7 $1,021.8 $43.9 $5,325.9 NA $11.8 $6,743.5 -$392.6 $2,791.7 $9,142.6
2017 $326.7 $925.5 $54.6 $4,548.9 NA $8.1 $5,864.0 –$375.7 $2,755.8 $8,244.0
2016 $329.3 $800.4 $66.7 $3,996.2 NA $8.8 $5,201.4 –$385.8 $2,732.2 $7,547.7
2015 $365.9 $904.0 $77.2 $4,579.2 NA $9.9 $5,936.1 –$427.4 $2,626.8 $8,135.5
2014 $395.5 $1,124.9 $81.0 $6,525.6 NA $15.5 $8,142.5 –$475.2 $2,671.4 $10,338.7
2013 $423.1 $994.8 $60.0 $6,602.1 NA $15.1 $8,095.1 –$483.0 $2,682.6 $10,294.7
2012 $427.6 $837.2 $46.5 $6,687.3 NA $12.2 $8,010.9 –$475.9 $2,581.1 $10,116.0
2011 $437.9 $1,073.9 $50.2 $6,565.8 NA $13.1 $8,141.0 –$487.9 $2,338.2 $9,991.4
2010 $366.3 $1,112.5 $74.8 $5,382.3 $113.7 $14.2 $6,950.0 –$452.9 $2,244.2 $8,741.4
2009 $338.0 $1,119.4 $55.6 $3,982.6 $86.5 $11.8 $5,507.4 –$402.9 $2,050.2 $7,154.7
2008 $222.6 $1,565.8 $47.1 $5,685.3 $118.9 $14.1 $7,535.0 –$327.1 $1,895.1 $9,103.0
2007 $200.5 $1,327.1 $53.2 $4,931.0 $60.7 $11.4 $6,523.9 –$342.6 $1,775.3 $7,956.6
2006 $191.5 $1,180.0 $44.4 $4,417.7 $30.3 $8.5 $5,842.1 –$281.0 $1,655.6 $7,216.7
2005 $166.7 $1,073.5 $39.2 $3,842.5 $27.0 $7.5 $5,129.5 –$265.9 $1,584.4 $6,448.0
2004 $151.5 $858.4 $46.8 $3,078.2 $43.4 $7.5 $4,142.5 –$213.0 $1,475.5 $5,404.9
2003 $140.3 $775.6 $36.1 $2,524.5 $38.6 $6.7 $3,483.3 –$196.3 $1,458.3 $4,745.3
2002 $131.2 $607.5 $46.3 $2,173.7 $31.5 $5.6 $2,964.3 –$190.3 $1,423.6 $4,197.6
2001 $134.2 $868.7 $40.3 $2,257.0 $26.6 $5.0 $3,305.2 –$184.0 $1,333.2 $4,454.4
2000 $122.8 $673.4 $55.1 $2,430.5 $33.2 $4.8 $3,286.7 –$196.3 $1,291.8 $4,382.1
1999 $117.0 $487.4 $63.1 $1,902.6 $17.8 $3.1 $2,574.0 –$184.5 $1,211.8 $3,601.3
1998 $126.2 $517.5 $53.1 $1,752.8 $14.3 $3.0 $2,453.4 –$184.0 $1,227.3 $3,496.7
1997 $119.8 $612.9 $62.7 $1,960.9 $16.0 $4.8 $2,761.1 –$181.0 $1,196.3 $3,776.4
1996 $132.6 $545.0 $63.4 $2,040.2 $14.6 $6.0 $2,787.2 –$194.4 $1,143.1 $3,735.8
1995 $138.8 $506.6 $53.5 $1,697.3 $20.7 $3.8 $2,400.1 –$189.5 $1,127.9 $3,338.5
1994 $128.4 $509.2 $48.1 $1,641.7 $17.4 $3.8 $2,331.3 –$172.1 $1,090.5 $3,249.7
1993 $130.2 $512.4 $45.7 $1,602.7 $25.4 $4.1 $2,295.1 –$172.1 $1,038.7 $3,161.7
1992 $110.2 $419.0 $52.6 $1,620.8 $31.1 $4.9 $2,238.7 –$158.3 $983.2 $3,063.6
1991 $117.7 $438.8 $52.2 $1,640.1 $27.4 $5.0 $2,281.1 –$168.3 $1,019.1 $3,131.9
1990 $110.1 $415.4 $48.8 $1,726.3 $23.4 $5.0 $2,329.0 –$160.7 $995.7 $3,163.9
1989 $111.9 $436.5 $55.6 $1,514.2 $22.9 $3.1 $2,144.2 –$167.5 $972.0 $2,948.8
1988 $121.6 $439.0 $45.9 $1,382.5 $15.7 $2.7 $2,007.5 –$165.9 $914.0 $2,755.6
1987 $114.1 $383.6 $57.1 $1,360.4 $15.5 $2.5 $1,933.1 –$167.6 $864.2 $2,629.7
1986 $118.3 $408.4 $51.7 $1,254.9 $11.9 $3.1 $1,848.4 –$166.7 $846.3 $2,528.0
1985 $135.8 $523.7 $28.7 $1,557.2 $15.3 $4.3 $2,265.0 –$158.2 $841.2 $2,948.1
1984 $163.3 $567.2 $35.5 $1,549.5 $15.5 $4.3 $2,335.3 –$191.7 $826.9 $2,970.5
1983 $130.5 $542.5 $41.1 $1,612.2 $14.2 $3.5 $2,344.0 –$169.7 $816.8 $2,991.1
1982 $117.4 $499.6 $66.2 $1,653.4 $7.9 $3.9 $2,348.4 –$181.3 $644.5 $2,811.7
1981 $118.9 $395.7 $36.3 $1,695.0 $3.4 $3.3 $2,252.6 –$154.8 $628.9 $2,726.8
1980 $119.3 $354.1 $27.7 $1,566.2 $0.0 $3.0 $2,070.4 –$164.7 $550.6 $2,456.3
1979 $93.8 $291.2 $27.5 $1,292.0 $0.0 $1.2 $1,705.7 –$133.8 $447.6 $2,019.6
1978 $70.7 $227.2 $16.6 $1,041.7 $0.0 $1.0 $1,357.3 –$99.7 $412.0 $1,669.5
1977 $63.7 $236.1 $16.0 $964.4 $0.0 $0.9 $1,281.1 –$92.6 $363.4 $1,551.8
1976 $51.4 $200.6 $12.9 $900.4 $0.0 $0.8 $1,166.0 –$82.2 $326.6 $1,410.4
1975 $28.4 $184.3 $11.0 $777.6 $0.0 $0.7 $1,001.9 –$68.1 $271.2 $1,204.9
1974 $19.6 $150.9 $7.0 $703.8 $0.0 $0.6 $882.0 –$53.2 $226.0 $1,054.8
1973 $16.0 $134.4 $1.1 $519.3 $0.0 $0.6 $671.4 –$39.5 $203.7 $835.6
1972 $13.6 $130.7 $0.0 $450.6 $0.0 $0.5 $595.5 –$32.8 $191.9 $754.6
1971 $10.9 $115.7 $0.0 $417.3 $0.0 $0.3 $544.2 –$24.9 $187.9 $707.2
1970 $9.8 $104.1 $0.0 $405.7 $0.0 $0.3 $519.8 –$22.3 $170.3 $667.8

Petroleum Products Expenditures
Nebraska
1970 – 2021

(Million Nominal Dollars)

Year Primary Energy Resources
Petroleum
Asphalt
and
Road
Oil
Aviation
Gasoline
Distillate
Fuel
Jet
Fuel
Kerosene Lubri­cants Motor
Gasoline
Other
Petroleum 1
Propane Residual
Fuel
2021 $115.4 $5.0 $2,534.9 $87.7 $0.2 $143.1 $2,604.9 $20.4 $192.5 $0.3
2020 $88.9 $4.0 $1,853.9 $44.8 $0.1 $124.3 $1,722.0 $12.3 $123.9 $0.2
2019 $85.1 $4.8 $2,407.9 $94.3 $0.2 $132.1 $2,293.1 $18.70 $147.8 $0.2
2018 $67.2 $5.1 $2,480.3 $71.0 $0.2 $128.5 $2,402.3 $22.40 $148.6 $0.4
2017 $56.5 $4.7 $1,990.1 $50.7 $0.1 $121.1 $2,151.3 $11.5 $117.6 $0.1
2016 $48.6 $4.0 $1,709.0 $33.2 $0.2 $129.1 $1,924.8 $9.7 $97.8 $0.0
2015 $76.0 $4.2 $2,038.6 $50.4 $0.1 $136.8 $2,118.5 $11.0 $173.9 $0.0
2014 $96.2 $6.4 $2,955.5 $67.4 $0.4 $129.6 $2,950.6 $18.7 $280.1 $0.1
2013 $90.9 $5.7 $3,038.9 $91.1 $0.2 $124.3 $2,962.5 $19.3 $287.7 $0.0
2012 $115.0 $7.3 $3,173.0 $74.8 $0.2 $122.0 $2,968.0 $7.1 $212.5 $0.1
2011 $95.0 $7.4 $3,072.5 $77.8 $0.3 $127.9 $2,896.1 $7.1 $264.2 $0.1
2010 $97.4 $6.3 $2,476.9 $57.5 $0.7 $113.9 $2,351.2 $6.1 $237.3 $0.1
2009 $79.5 $6.5 $1,578.2 $48.2 $0.8 $97.8 $1,925.3 $3.9 $242.8 $0.4
2008 $50.3 $9.1 $2,470.2 $113.6 $0.6 $106.9 $2,630.6 $6.9 $291.9 $6.3
2007 $52.1 $9.5 $2,013.9 $87.8 $1.1 $98.5 $2,404.7 $5.4 $254.4 $3.5
2006 $54.4 $9.0 $1,778.6 $88.4 $0.9 $88.8 $2,145.1 $5.4 $243.4 $3.8
2006 $41.6 $7.7 $1,543.4 $69.9 $1.6 $73.2 $1,876.5 $3.6 $219.1 $5.9
2004 $41.2 $4.3 $1,138.3 $45.7 $1.3 $62.9 $1,579.9 $3.2 $194.3 $7.3
2003 $42.1 $5.1 $865.7 $45.0 $0.8 $59.6 $1,316.3 $2.9 $183.6 $3.4
2002 $23.0 $5.0 $681.4 $47.1 $0.3 $59.5 $1,182.0 $3.0 $169.7 $2.6
2001 $24.3 $4.8 $746.2 $37.5 $1.0 $55.3 $1,231.6 $3.7 $149.4 $3.2
2000 $29.5 $3.5 $853.2 $47.2 $0.8 $57.1 $1,287.0 $2.3 $146.6 $3.5
1999 $38.7 $3.2 $732.9 $36.2 $0.3 $57.6 $931.0 $2.5 $99.0 $1.3
1998 $28.6 $2.6 $689.6 $21.4 $0.6 $53.0 $867.3 $2.7 $85.1 $1.9
1997 $33.0 $4.2 $741.5 $28.0 $0.8 $51.6 $995.0 $3.4 $101.5 $1.8
1996 $36.7 $3.5 $774.9 $27.9 $0.7 $48.4 $1,017.7 $3.6 $123.8 $3.1
1995 $20.2 $3.2 $587.1 $22.7 $0.5 $50.1 $928.0 $4.0 $79.6 $1.8
1994 $19.9 $3.0 $582.3 $28.1 $0.7 $50.9 $869.4 $4.2 $80.4 $2.8
1993 $15.5 $3.0 $563.8 $27.8 $0.8 $50.2 $859.6 $3.2 $74.9 $3.9
1992 $15.6 $3.5 $566.7 $30.7 $0.7 $49.6 $857.6 $3.8 $90.2 $2.3
1991 $29.9 $3.7 $542.6 $33.1 $0.7 $48.8 $882.0 $2.4 $94.4 $2.5
1990 $29.0 $3.9 $562.3 $50.0 $1.9 $49.8 $920.2 $7.4 $98.2 $3.6
1989 $23.2 $3.9 $473.6 $37.1 $0.7 $44.4 $814.6 $8.9 $103.0 $4.8
1988 $29.7 $3.6 $462.0 $34.2 $2.1 $41.6 $705.4 $6.1 $92.3 $5.6
1987 $31.7 $3.4 $442.6 $32.9 $3.0 $40.4 $711.9 $6.7 $83.4 $4.2
1986 $24.9 $5.0 $393.2 $32.8 $4.8 $37.8 $679.4 $6.6 $66.2 $4.3
1985 $15.8 $4.9 $470.8 $45.9 $3.2 $39.0 $901.4 $5.6 $68.9 $1.7
1984 $20.8 $5.5 $474.4 $49.3 $3.8 $41.8 $896.6 $5.5 $49.7 $2.0
1983 $21.5 $6.3 $459.0 $53.9 $3.3 $37.6 $904.3 $5.9 $117.4 $2.9
1982 $21.8 $6.8 $380.8 $57.2 $3.7 $35.6 $1,027.3 $6.0 $109.1 $5.1
1981 $24.5 $11.7 $362.4 $60.9 $3.7 $40.7 $1,095.0 $6.8 $87.6 $1.7
1980 $18.6 $9.7 $332.7 $56.2 $2.0 $33.9 $1,008.9 $3.3 $96.7 $4.3
1979 $14.0 $5.2 $317.5 $42.3 $1.4 $27.0 $796.6 $2.6 $75.4 $9.8
1978 $23.5 $4.5 $225.4 $31.9 $8.9 $19.2 $638.0 $2.2 $75.2 $13.0
1977 $15.0 $3.7 $185.6 $26.2 $10.2 $16.4 $606.3 $1.7 $87.2 $11.9
1976 $7.7 $2.5 $158.2 $21.1 $10.4 $23.4 $573.0 $1.8 $86.2 $15.9
1975 $10.3 $2.5 $117.9 $19.3 $8.2 $22.3 $516.3 $1.4 $68.0 $11.2
1974 $11.6 $2.8 $113.2 $15.8 $8.5 $22.7 $457.5 $1.4 $60.0 $10.1
1973 $5.1 $2.0 $69.4 $8.5 $6.7 $17.5 $352.8 $1.4 $52.9 $2.9
1972 $5.1 $1.0 $53.4 $7.4 $5.4 $16.1 $321.3 $1.0 $36.9 $3.0
1971 $6.1 $2.2 $43.9 $7.8 $4.7 $14.2 $303.0 $0.9 $32.5 $2.0
1970 $5.3 $2.2 $41.4 $7.3 $3.9 $14.8 $294.4 $0.0 $34.1 $2.3

Sources: State Energy Price and Expenditure Report. Energy Information Administration, Washington, DC. Nebraska Department of Environment and Energy, Lincoln, NE.

Notes: There are no direct fuel costs for hydroelectric, geothermal, wind, photovoltaic, or solar thermal energy. There is a discontinuity in this time series between 1988 and 1989 due to the expanded coverage of non–electric utility use of wood and waste beginning in 1989. Totals may not equal the sum of the components due to independent rounding. NA indicates data not available.

1 Other petroleum includes the subtotal of sixteen (16) petroleum products consumed in the industrial sector.

The table and graph were updated on January 9, 2024.
Typically, there are one to two years between updates.

Return to top of page