Nebraska Department of Environment and Energy

Air Water Land Energy

Nebraska Energy Statistics

Nebraska's
Renewable Energy Consumption

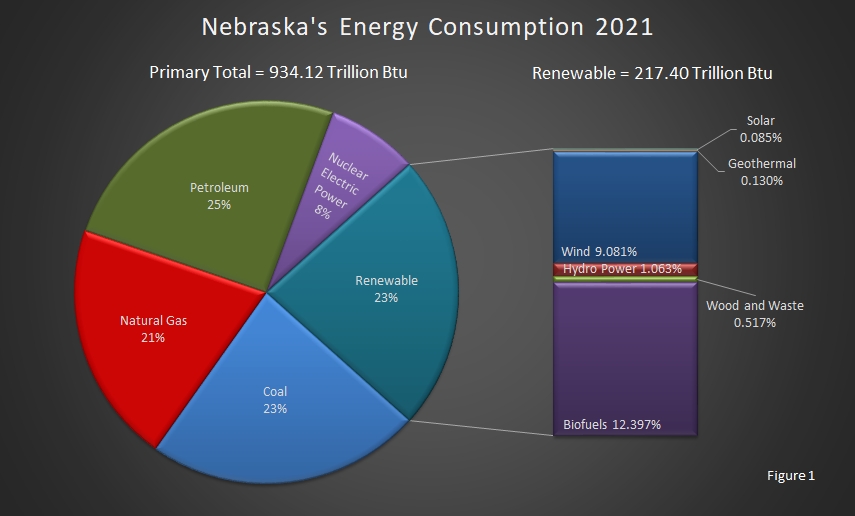
In 2021, Nebraska consumed 934.12 trillion British thermal units (Btu) of primary energy and 217.40 trillion Btu of energy from renewable energy resources as shown in Figure 1 below.

Renewable resources met 23 percent of Nebraska's energy consumption as shown in the data table below. Nebraska consumed energy from these renewable resources in 2021:

  • Biofuels (Fuel Ethanol, Biodiesel, and Losses and Co–products)
  • Geothermal Energy
  • Hydroelectric Power (Conventional)
  • Photovoltaic and Solar Thermal Energy
  • Wind Energy
  • Wood and Waste

Return to top of page

chart showing Nebraska's Energy Consumption.

Return to top of page

From 1960 to 1980, renewable energy in Nebraska consisted of conventional hydroelectric power and biomass. Ethanol entered the picture in the early 1980s. Geothermal energy and photovoltaic and solar thermal energy projects were reported in the late 1980s. Wind energy projects came on line in the late 1990s. Consumption of renewable energy has steadily increased.

As a percentage of primary energy consumption, renewable energy consumption was relatively stable until 1995 when the percentage began an upward climb. Biofuels had a major role in this increase. Renewable energy consumption has ranged from 2.80 percent to 23.00 percent of total energy consumption. The energy used to produce ethanol and biodiesel and the energy value contained in the dry/wet co–products has been added to the annual data.

This report provides the amount of renewable energy used by Nebraskans. The amount of renewable energy that generated electricity can be found in the report Annual Electricity Generation by Fuel Type.

Return to top of page

Renewable Energy Consumption by Fuel Type,
Nebraska, 2020 – 2021

[Trillion British Thermal Units (Btu)]

Year Biofuels Biomass Geothermal Hydroelectric
Power
Photovoltaic
and
Solar Thermal
Wind Total
Renewable
Energy
Consumption
Total
Primary
Energy
Consumption
Renewable
Energy
Percent
Year Biofuels Biomass Geothermal Hydroelectric
Power
Photovoltaic
and
Solar Thermal
Wind Total
Renewable
Energy
Consumption
Total
Primary
Energy
Consumption
Renewable
Energy
Percent
2021 115.80 4.83 1.21 9.93 0.79 84.83 217.40 934.12 23.27%
2020 104.15 4.72 1.21 12.19 0.68 79.91 202.86 902.15 22.49%

Return to top of page

Renewable Energy Consumption by Fuel Type,
Nebraska, 1990 – 2019

[Trillion British Thermal Units (Btu)]

Year Biofuels Biomass Geothermal Hydroelectric
Power
Photovoltaic
and
Solar Thermal
Wind Total
Renewable
Energy
Consumption
Total
Primary
Energy
Consumption
Renewable
Energy
Percent
Year Biofuels Biomass Geothermal Hydroelectric
Power
Photovoltaic
and
Solar Thermal
Wind Total
Renewable
Energy
Consumption
Total
Primary
Energy
Consumption
Renewable
Energy
Percent
2019 113.53 5.50 1.21 11.94 0.45 64.22 203.93 907.22 20.92%
2018 120.70 5.20 1.21 12.58 0.37 50.52 193.62 955.12 20.30%
2017 119.53 3.97 1.21 13.72 0.22 46.84 185.61 905.38 20.80%
2016 112.89 4.07 1.21 7.91 0.09 35.07 161.23 911.20 17.69%
2015 107.83 4.03 1.21 15.70 0.04 29.64 158.45 940.06 16.86%
2014 101.94 4.68 1.21 11.01 0.04 26.03 144.91 944.41 15.35%
2013 102.59 4.61 1.21 10.72 0.04 17.19 136.36 915.22 14.90%
2012 103.54 3.65 1.21 11.96 0.03 12.22 132.61 861.92 15.39%
2011 112.79 3.88 1.20 15.71 0.03 10.21 143.82 907.64 15.85%
2010 102.23 7.75 1.15 12.82 0.03 4.11 128.09 910.63 14.07%
2009 69.44 7.79 1.02 4.23 0.03 3.73 86.24 817.27 10.55%
2008 70.35 7.36 0.88 3.41 0.03 2.11 84.13 810.80 10.38%
2007 49.89 7.14 0.79 3.43 0.02 2.14 63.43 779.28 8.14%
2006 36.10 6.37 0.73 8.86 0.02 2.59 54.68 736.64 7.42%
2005 33.10 8.04 0.67 8.71 0.02 0.97 51.51 721.23 7.14%
2004 33.39 8.58 0.57 9.15 0.01 0.39 52.08 732.40 7.11%
2003 26.06 8.63 0.51 10.04 0.01 0.39 45.53 705.36 6.45%
2002 24.31 8.24 0.38 11.16 0.01 0.08 44.19 711.77 6.21%
2001 23.73 7.65 0.35 11.62 0.01 0.03 43.39 701.18 6.19%
2000 22.38 5.73 0.32 15.31 0.01 0.00 43.69 689.94 6.33%
1999 20.76 6.00 0.32 17.58 0.01 0.00 44.61 716.22 6.23%
1998 19.38 5.80 0.31 17.16 0.02 0.00 42.67 709.20 6.02%
1997 18.27 6.32 0.25 17.08 0.02 0.00 41.93 695.40 6.03%
1996 13.84 7.77 0.22 16.56 0.02 0.00 38.42 682.73 5.63%
1995 14.31 4.18 0.18 14.71 0.02 0.00 33.38 635.33 5.25%
1994 6.91 4.10 0.16 13.53 0.02 0.00 24.72 582.56 4.24%
1993 6.11 4.27 0.15 10.33 0.01 0.00 20.86 580.28 3.59%
1992 4.92 4.97 0.12 11.12 0.01 0.00 21.14 560.40 3.77%
1991 3.75 4.67 0.10 10.90 0.01 0.00 19.44 568.48 3.42%
1990 3.30 4.46 0.08 11.86 0.01 0.00 19.71 553.29 3.56%

Return to top of page

Renewable Energy Consumption by Fuel Type,
Nebraska, 1960 – 1989

[Trillion British Thermal Units (Btu)]

Year Biofuels Biomass Geothermal Hydroelectric
Power
Photovoltaic
and
Solar Thermal
Wind Total
Renewable
Energy
Consumption
Total
Primary
Energy
Consumption
Renewable
Energy
Percent
Year Biofuels Biomass Geothermal Hydroelectric
Power
Photovoltaic
and
Solar Thermal
Wind Total
Renewable
Energy
Consumption
Total
Primary
Energy
Consumption
Renewable
Energy
Percent
1989 3.52 6.40 0.06 12.08 0.01 0.00 22.07 562.16 3.93%
1988 2.96 6.06 0.00 13.94 0.00 0.00 22.96 568.66 4.04%
1987 2.83 5.68 0.00 16.33 0.00 0.00 24.83 537.27 4.62%
1986 2.34 6.77 0.00 17.53 0.00 0.00 26.65 511.33 5.21%
1985 2.16 7.42 0.00 15.05 0.00 0.00 24.63 494.67 4.98%
1984 1.62 7.20 0.00 14.04 0.00 0.00 22.85 526.83 4.34%
1983 1.48 5.88 0.00 14.16 0.00 0.00 21.52 513.53 4.19%
1982 0.74 6.33 0.00 12.67 0.00 0.00 19.74 533.97 3.70%
1981 0.30 5.30 0.00 12.51 0.00 0.00 18.11 492.79 3.68%
1980 0.00 5.90 0.00 13.88 0.00 0.00 19.78 526.05 3.76%
1979 0.00 3.93 0.00 12.90 0.00 0.00 16.83 582.52 2.89%
1978 0.00 3.79 0.00 12.30 0.00 0.00 16.10 569.77 2.82%
1977 0.00 3.40 0.00 12.74 0.00 0.00 16.14 575.63 2.80%
1976 0.00 3.14 0.00 13.24 0.00 0.00 16.38 561.68 2.92%
1975 0.00 2.77 0.00 12.62 0.00 0.00 15.40 539.41 2.85%
1974 0.00 2.65 0.00 13.51 0.00 0.00 16.16 526.98 3.07%
1973 0.00 2.67 0.00 14.24 0.00 0.00 16.91 505.36 3.35%
1972 0.00 2.58 0.00 14.24 0.00 0.00 16.82 488.24 3.45%
1971 0.00 1.60 0.00 14.24 0.00 0.00 15.85 463.17 3.42%
1970 0.00 1.57 0.00 14.38 0.00 0.00 15.95 462.07 3.45%
1969 0.00 1.60 0.00 12.93 0.00 0.00 14.53 434.06 3.35%
1968 0.00 1.67 0.00 13.04 0.00 0.00 14.71 412.73 3.57%
1967 0.00 1.74 0.00 12.14 0.00 0.00 13.88 378.95 3.66%
1966 0.00 1.85 0.00 12.11 0.00 0.00 13.96 381.08 3.66%
1965 0.00 1.90 0.00 11.66 0.00 0.00 13.56 339.67 3.99%
1964 0.00 2.31 0.00 10.49 0.00 0.00 12.80 345.34 3.71%
1963 0.00 2.57 0.00 10.63 0.00 0.00 13.20 335.70 3.93%
1962 0.00 2.67 0.00 10.30 0.00 0.00 12.97 326.89 3.97%
1961 0.00 2.95 0.00 9.88 0.00 0.00 12.83 314.06 4.09%
1960 0.00 3.11 0.00 10.32 0.00 0.00 13.43 310.02 4.33%

Return to top of page

Sources: State Energy Data Report. Energy Information Administration, Washington, DC. Nebraska Department of Environment and Energy, Lincoln, NE.

Note: Consumption is listed in Btu to enable totaling all the categories of energy.

This table was updated on January 9, 2024.
Typically, there are one to two years between updates.

Return to top of page