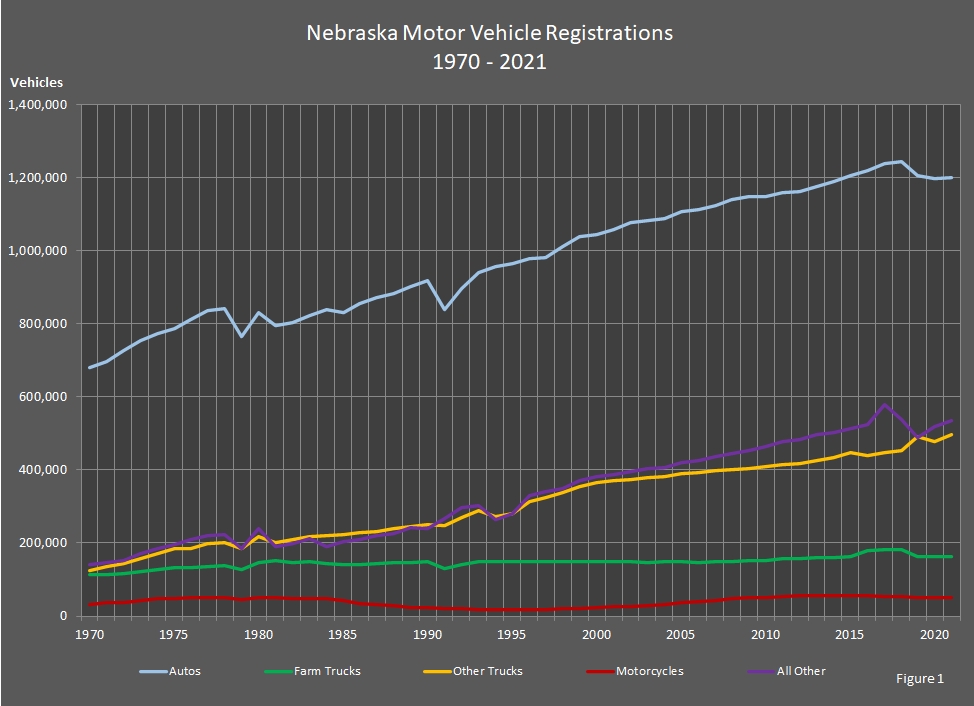
The graph and data table below show motor vehicle registrations in Nebraska each year. For select years, historical numbers are available.
Nebraska Department of Environment and Energy
Air Water Land Energy
Nebraska Energy Statistics
Nebraska Motor Vehicle Registrations
| Year | Autos | Farm
Trucks |
Other
Trucks |
Motor-
cycles |
All
Other |
Annual
Total |
|---|---|---|---|---|---|---|
| Year | Autos | Farm
Trucks |
Other
Trucks |
Motor-
cycles |
All
Other |
Annual
Total |
| 2021 | 1,198,824 | 162,966 | 496,209 | 51,153 | 536,185 | 2,445,337 |
| 2020 | 1,197,842 | 161,743 | 476,831 | 50,373 | 517,791 | 2,398,328 |
| 2019 | 1,205,150 | 162,509 | 492,422 | 50,647 | 488,790 | 2,399,518 |
| 2018 | 1,242,548 | 182,481 | 454,098 | 53,566 | 538,624 | 2,471,317 |
| 2017 | 1,239,329 | 182,567 | 448,246 | 54,863 | 578,158 | 2,503,163 |
| 2016 | 1,220,465 | 180,732 | 439,256 | 55,340 | 525,438 | 2,421,231 |
| 2015 | 1,205,595 | 162,167 | 446,600 | 55,585 | 512,853 | 2,382,800 |
| 2014 | 1,188,368 | 161,295 | 433,550 | 55,475 | 501,298 | 2,339,986 |
| 2013 | 1,174,669 | 161,033 | 426,914 | 55,833 | 496,677 | 2,315,126 |
| 2012 | 1,161,629 | 158,737 | 418,758 | 55,461 | 484,085 | 2,278,670 |
| 2011 | 1,158,374 | 157,286 | 414,918 | 53,773 | 477,327 | 2,261,678 |
| 2010 | 1,148,305 | 153,216 | 408,548 | 51,359 | 462,673 | 2,224,101 |
| 2009 | 1,147,354 | 151,530 | 403,368 | 50,322 | 452,393 | 2,204,967 |
| 2008 | 1,140,386 | 150,027 | 399,923 | 49,191 | 444,575 | 2,184,102 |
| 2007 | 1,122,877 | 148,047 | 397,333 | 43,387 | 436,417 | 2,148,061 |
| 2006 | 1,112,320 | 147,509 | 392,589 | 40,065 | 426,611 | 2,119,094 |
| 2005 | 1,106,684 | 148,625 | 389,947 | 36,622 | 419,667 | 2,101,545 |
| 2004 | 1,088,620 | 148,278 | 383,024 | 32,916 | 406,715 | 2,059,553 |
| 2003 | 1,081,868 | 147,571 | 378,615 | 29,794 | 402,855 | 2,040,703 |
| 2002 | 1,076,415 | 148,456 | 372,929 | 26,931 | 394,198 | 2,018,929 |
| 2001 | 1,057,498 | 149,116 | 370,272 | 25,010 | 388,482 | 1,990,378 |
| 2000 | 1,043,491 | 148,421 | 364,198 | 22,758 | 381,986 | 1,960,854 |
| 1999 | 1,038,583 | 149,034 | 355,438 | 20,612 | 369,682 | 1,933,349 |
| 1998 | 1,011,801 | 148,433 | 337,946 | 19,344 | 349,547 | 1,867,071 |
| 1997 | 981,372 | 149,471 | 324,010 | 18,441 | 341,058 | 1,814,352 |
| 1996 | 977,252 | 148,051 | 312,213 | 18,094 | 330,929 | 1,786,539 |
| 1995 | 965,100 | 148,181 | 279,781 | 18,696 | 281,287 | 1,693,045 |
| 1994 | 955,138 | 148,664 | 272,685 | 19,084 | 264,965 | 1,660,536 |
| 1993 | 940,667 | 149,403 | 288,608 | 18,882 | 301,757 | 1,699,317 |
| 1992 | 895,461 | 140,095 | 269,195 | 19,582 | 296,302 | 1,620,635 |
| 1991 | 838,803 | 128,969 | 247,831 | 20,264 | 266,178 | 1,502,045 |
| 1990 | 917,722 | 147,982 | 250,589 | 22,375 | 238,211 | 1,576,879 |
| 1989 | 901,633 | 145,749 | 245,664 | 23,560 | 243,514 | 1,560,120 |
| 1988 | 882,451 | 145,460 | 239,560 | 29,088 | 224,954 | 1,521,513 |
| 1987 | 870,291 | 144,126 | 231,572 | 31,599 | 219,821 | 1,497,409 |
| 1986 | 856,574 | 140,987 | 228,188 | 33,077 | 208,849 | 1,467,675 |
| 1985 | 831,299 | 140,187 | 223,280 | 43,248 | 202,844 | 1,440,858 |
| 1984 | 837,810 | 143,947 | 221,757 | 47,384 | 191,093 | 1,441,991 |
| 1983 | 821,454 | 148,061 | 216,735 | 47,712 | 212,218 | 1,446,180 |
| 1982 | 803,750 | 145,180 | 209,696 | 47,887 | 198,953 | 1,405,466 |
| 1981 | 796,130 | 151,998 | 202,194 | 50,371 | 189,558 | 1,390,251 |
| 1980 | 830,360 | 147,062 | 216,679 | 52,142 | 240,845 | 1,487,088 |
| 1979 | 765,533 | 126,176 | 184,215 | 44,218 | 184,977 | 1,305,119 |
| 1978 | 840,579 | 139,258 | 201,965 | 49,871 | 222,713 | 1,454,386 |
| 1977 | 834,953 | 136,079 | 198,617 | 50,362 | 220,252 | 1,440,263 |
| 1976 | 810,931 | 132,126 | 184,937 | 49,556 | 209,832 | 1,387,382 |
| 1975 | 786,655 | 131,765 | 183,675 | 48,198 | 196,256 | 1,346,549 |
| 1974 | 772,293 | 128,749 | 171,837 | 47,399 | 184,595 | 1,304,873 |
| 1973 | 753,944 | 121,671 | 157,832 | 41,288 | 172,107 | 1,246,842 |
| 1972 | 726,670 | 115,701 | 142,788 | 37,649 | 153,278 | 1,176,086 |
| 1971 | 695,643 | 113,918 | 135,692 | 35,940 | 145,556 | 1,126,749 |
| 1970 | 679,728 | 113,127 | 125,174 | 31,552 | 141,599 | 1,091,180 |
Sources: Annual Registration Statistics by County 1999–Current. Categorized by Use Type. Nebraska Department of Motor Vehicles, Lincoln, NE. Nebraska Department of Environment and Energy, Lincoln, NE.
Notes: All Other includes bus, trailer, dealer, government, mobile home, snowmobile and tax exempt registrations. Other Trucks includes commercial, nonresident commercial, local, minitruck, message commercial, spirit commercial, spirit message commercial, gold star commercial, gold star message commercial, organizational commercial, message farm, spirit farm, spirit message farm, gold star farm, gold star message farm, organizational farm, special mobile equipment (SME), soil and water, farm semi-tractor/trailer, 10% reduction, and apportioned power units. Data entry totals are incomplete for 1991. Apportioned power units and trailer units are reported by DMV as part of 1996-98 totals; those values are subtracted from 1996-98 numbers to make the data consistent with previous years.
The table and graph were updated on December 19, 2022.
Typically, there is one year between updates.