Nebraska Department of Environment and Energy

Air Water Land Energy

Nebraska Energy Statistics

Electricity Expenditures in Nebraska
by End–Use Sector

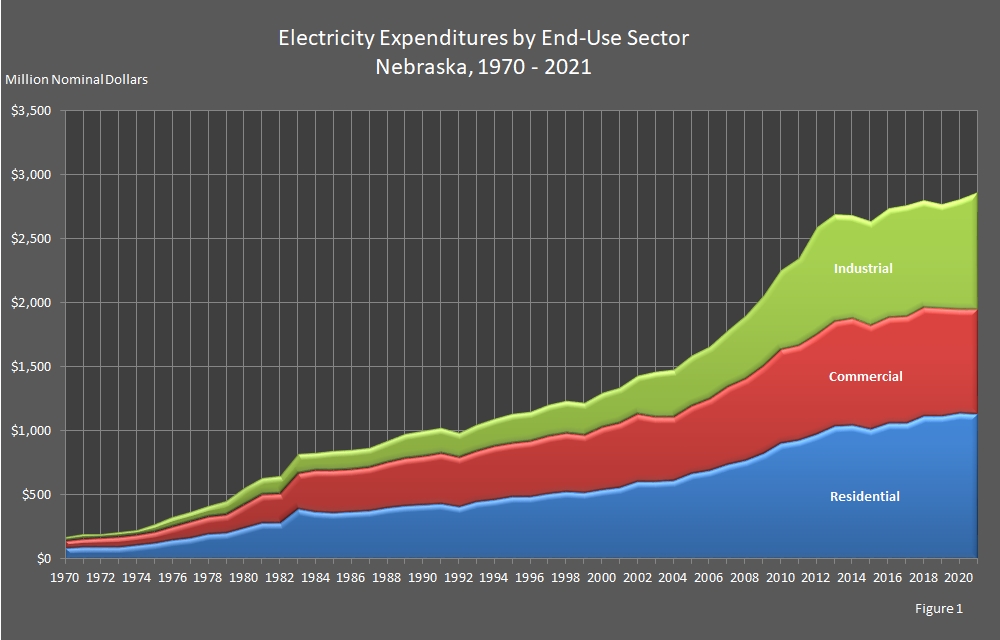
Expenditures for electricity rose to $2,857.9 million in 2021, which was 2.2 percent more than the $2,797.0 million spent on electricity in 2020. The residential sector spent 39.5 percent of the total with the industrial sector spending 32.0 percent and the commercial sector spending 28.5 percent.

The expenditures are in nominal dollars to provide a better comparison.

Return to top of page

chart showing Electricity Expenditures by End-Use Sector in Nebraska.

Return to top of page

Electricity Expenditures by End–Use Sector
Nebraska, 2010 – 2021

(Million Nominal Dollars)

Year End–Use Sectors Annual
Total
Commercial Industrial Residential
2021 $815.5 $914.4 $1,128.0 $2,857.9
2020 $808.0 $853.7 $1,135.3 $2,797.0
2019 $836.9 $812.6 $1,109.7 $2,759.2
2018 $843.3 $834.0 $1,114.4 $2,791.7
2017 $822.1 $873.2 $1,060.4 $2,755.8
2016 $818.9 $857.7 $1,055.6 $2,732.2
2015 $807.4 $808.8 $1,010.5 $2,626.8
2014 $831.3 $797.1 $1,043.0 $2,671.4
2013 $807.5 $837.4 $1,037.8 $2,682.6
2012 $773.9 $834.9 $972.3 $2,581.1
2011 $729.8 $681.0 $927.3 $2,338.2
2010 $727.8 $613.0 $903.4 $2,244.2

Return to top of page

Electricity Expenditures by End–Use Sector
Nebraska, 1990 – 2009

(Million Nominal Dollars)

Year End–Use Sectors Annual
Total
Commercial Industrial Residential
2009 $682.8 $547.1 $820.3 $2,050.2
2008 $631.2 $496.4 $767.6 $1,895.1
2007 $600.5 $434.8 $740.0 $1,775.3
2006 $557.8 $409.0 $688.8 $1,655.6
2005 $528.8 $390.6 $665.0 $1,584.4
2004 $496.8 $368.9 $609.7 $1,475.5
2003 $498.6 $351.9 $607.8 $1,458.3
2002 $526.8 $293.9 $602.9 $1,423.6
2001 $495.5 $275.8 $561.9 $1,333.2
2000 $484.3 $262.8 $544.6 $1,291.8
1999 $448.7 $245.9 $517.1 $1,211.8
1998 $451.7 $248.8 $526.8 $1,227.3
1997 $448.7 $237.7 $510.0 $1,196.3
1996 $428.4 $227.7 $487.0 $1,143.1
1995 $420.9 $222.9 $484.1 $1,127.9
1994 $411.8 $213.3 $465.4 $1,090.5
1993 $386.8 $200.4 $451.6 $1,038.7
1992 $378.6 $193.2 $411.4 $983.2
1991 $389.5 $194.7 $435.0 $1,019.1
1990 $378.7 $193.5 $423.4 $995.7

Return to top of page

Electricity Expenditures by End–Use Sector
Nebraska, 1970 – 1989

(Million Nominal Dollars)

Year End–Use Sectors Annual
Total
Commercial Industrial Residential
1989 $374.0 $184.0 $414.0 $972.0
1988 $351.0 $158.0 $405.0 $914.0
1987 $333.8 $149.0 $381.4 $864.2
1986 $327.3 $146.4 $372.6 $846.3
1985 $327.2 $148.5 $365.5 $841.2
1984 $316.6 $139.3 $371.0 $826.9
1983 $277.7 $146.4 $392.7 $816.8
1982 $227.9 $130.7 $286.0 $644.5
1981 $217.0 $123.9 $288.0 $628.9
1980 $178.5 $123.0 $249.1 $550.6
1979 $142.9 $98.0 $206.8 $447.6
1978 $130.7 $84.2 $197.1 $412.0
1977 $120.6 $73.7 $169.1 $363.4
1976 $106.3 $70.2 $150.1 $326.6
1975 $86.9 $54.0 $130.3 $271.2
1974 $77.6 $37.2 $111.2 $226.0
1973 $72.8 $31.0 $99.9 $203.7
1972 $68.7 $26.8 $96.3 $191.9
1971 $65.3 $26.7 $95.9 $187.9
1970 $58.3 $25.0 $87.0 $170.3

Return to top of page

Sources: State Energy Price and Expenditure Report. Energy Information Administration, Washington, DC. Nebraska Department of Environment and Energy, Lincoln, NE.

Note: Totals may not equal the sum of the components due to independent rounding.

The table and graph were updated on January 9, 2024.
Typically, there are one to two years between updates.

Return to top of page