Nebraska Department of Environment and Energy
Air Water Land Energy
Nebraska Energy Statistics
Nebraska's Producing Crude Oil Wells
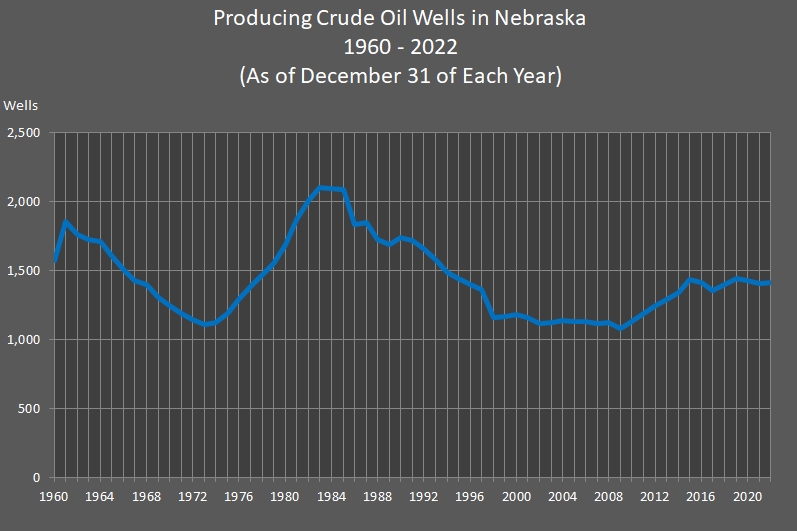
| Year | Producing Wells | Year | Producing Wells | Year | Producing Wells | Year | Producing Wells | Year | Producing Wells | Year | Producing Wells | Year | Producing Wells | ||||||
|---|---|---|---|---|---|---|---|---|---|---|---|---|---|---|---|---|---|---|---|
| 1960 | 1,571 | 1970 | 1,244 | 1980 | 1,693 | 1990 | 1,742 | 2000 | 1,179 | 2010 | 1,134 | 2020 | 1,429 | ||||||
| 1961 | 1,860 | 1971 | 1,191 | 1981 | 1,870 | 1991 | 1,716 | 2001 | 1,161 | 2011 | 1,186 | 2021 | 1,405 | ||||||
| 1962 | 1,764 | 1972 | 1,143 | 1982 | 2,006 | 1992 | 1,660 | 2002 | 1,119 | 2012 | 1,247 | 2022 | 1,417 | ||||||
| 1963 | 1,726 | 1973 | 1,107 | 1983 | 2,100 | 1993 | 1,582 | 2003 | 1,124 | 2013 | 1,288 | 2023 | NA | ||||||
| 1964 | 1,711 | 1974 | 1,127 | 1984 | 2,095 | 1994 | 1,489 | 2004 | 1,141 | 2014 | 1,340 | 2024 | NA | ||||||
| 1965 | 1,611 | 1975 | 1,190 | 1985 | 2,091 | 1995 | 1,446 | 2005 | 1,133 | 2015 | 1,436 | 2025 | NA | ||||||
| 1966 | 1,511 | 1976 | 1,291 | 1986 | 1,838 | 1996 | 1,402 | 2006 | 1,134 | 2016 | 1,415 | 2026 | NA | ||||||
| 1967 | 1,430 | 1977 | 1,382 | 1987 | 1,852 | 1997 | 1,361 | 2007 | 1,116 | 2017 | 1,353 | 2027 | NA | ||||||
| 1968 | 1,403 | 1978 | 1,469 | 1988 | 1,723 | 1998 | 1,160 | 2008 | 1,123 | 2018 | 1,397 | 2028 | NA | ||||||
| 1969 | 1,305 | 1979 | 1,551 | 1989 | 1,687 | 1999 | 1,170 | 2009 | 1,077 | 2019 | 1,441 | 2029 | NA |
Sources: "Nebraska Oil Activity Summary." Nebraska Oil and Gas Conservation Commission, Sidney, NE. Nebraska Department of Environment and Energy, Lincoln, NE.
The tables and graph were updated on February 13, 2024.
Typically, there is one year between updates.