Nebraska Department of Environment and Energy

Air Water Land Energy

Nebraska Energy Statistics

Nebraska's Petroleum
Average Annual Expenditures
by Product

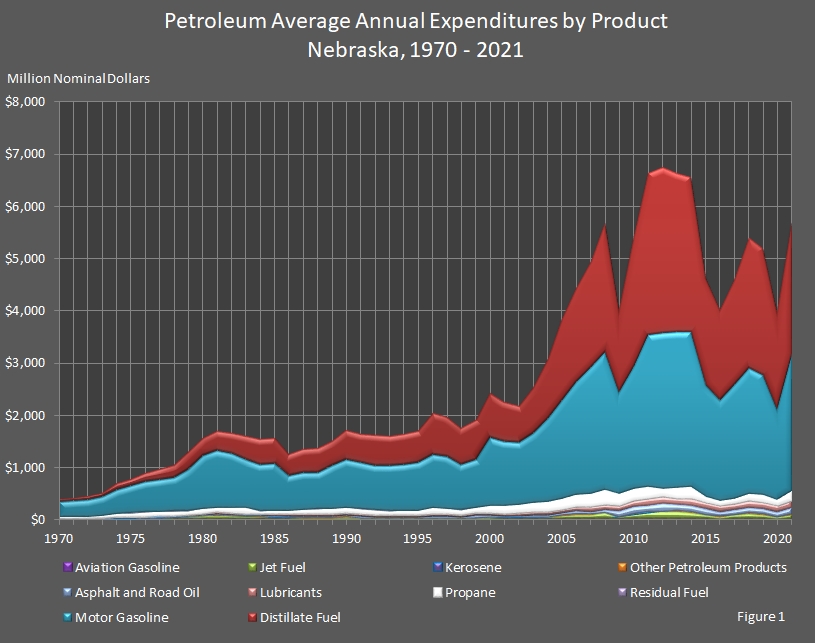
Expenditures on petroleum products increased 43.5 percent to $5,704.4 million ($5.7 billion) in 2021 from expenditures of $3,974.3 million ($4.0 billion) in 2020.

Motor gasoline expenditures and distillate fuel (diesel fuel and heating oil) expenditures comprised nearly all (90 percent) of the money spent on petroleum products in 2021. Propane expenditures were 3.4 percent, lubricants expenditures were 2.5 percent, jet fuel expenditures were 1.5 percent, and asphalt and road oil expenditures were 2.0 percent of the total. Expenditures on each of the other fuels were less than 1 percent of the total.

The expenditures are in nominal dollars to provide a better comparison.

Return to top of page

chart showing Petroleum Average Annual Expenditures by Product Nebraska.

Return to top of page

Nebraska Petroleum
Average Annual Expenditures
by Product
2010 – 2021

(Million Nominal Dollars)

Year Asphalt
& Road Oil
Aviation
Gasoline
Distillate
Fuel
Jet Fuel Kero­sene Lubri­cants Motor
Gasoline
Other
Petroleum1
Propane Residual
Fuel
Annual
Total
2021 $115.4 $5.0 $2,534.9 $87.7 $0.2 $143.1 $2,604.9 $20.4 $192.5 $0.3 $5,704.4
2020 $88.9 $4.0 $1,853.9 $44.8 $0.1 $124.3 $1,722.0 $12.3 $123.9 $0.2 $3,974.3
2019 $85.1 $4.8 $2,407.9 $94.3 $0.2 $132.1 $2,293.1 $18.7 $147.8 $0.2 $5,184.1
2018 $67.2 $5.1 $2,480.3 $71.0 $0.2 $128.5 $2,402.3 $22.4 $148.6 $0.4 $5,325.9
2017 $56.5 $4.4 $1,990.1 $50.7 $0.1 $121.4 $2,151.3 $11.5 $117.6 $0.1 $4,548.8
2016 $48.6 $4.1 $1,709.0 $33.2 $0.2 $129.2 $1,924.8 $9.7 $97.8 $0.0 $3,996.5
2015 $76.0 $4.2 $2,038.6 $50.4 $0.1 $136.8 $2,118.5 $11.0 $173.9 $0.0 $4,636.2
2014 $96.2 $6.4 $2,955.5 $67.4 $0.4 $129.6 $2,950.6 $18.7 $280.1 $0.1 $6,563.7
2013 $90.9 $5.7 $3,038.9 $91.1 $0.2 $124.3 $2,962.5 $19.3 $287.7 $0.0 $6,668.3
2012 $115.0 $7.3 $3,173.0 $74.8 $0.2 $122.0 $2,968.0 $7.1 $211.5 $0.1 $6,721.6
2011 $95.0 $7.4 $3,072.5 $77.8 $0.3 $127.9 $2,896.1 $7.1 $259.5 $0.1 $6,573.7
2010 $97.4 $6.3 $2,476.9 $57.5 $0.7 $113.9 $2,351.2 $6.1 $236.1 $0.1 $5,367.3

Return to top of page

Nebraska Petroleum
Average Annual Expenditures
by Product
1990 – 2009

(Million Nominal Dollars)

Year Asphalt
& Road Oil
Aviation
Gasoline
Distillate
Fuel
Jet Fuel Kero­sene Lubri­cants Motor
Gasoline
Other
Petroleum1
Propane Residual
Fuel
Annual
Total
2009 $79.5 $6.5 $1,578.2 $48.2 $0.8 $97.8 $1,925.3 $3.9 $242.0 $0.4 $3,982.6
2008 $50.3 $9.1 $2,470.2 $113.6 $0.6 $106.9 $2,630.6 $6.9 $290.9 $6.3 $5,685.3
2007 $52.1 $9.5 $2,013.9 $87.8 $1.1 $98.5 $2,404.7 $5.4 $254.4 $3.5 $4,931.0
2006 $54.4 $9.0 $1,778.6 $88.4 $0.9 $88.8 $2,145.1 $5.4 $243.4 $3.8 $4,417.7
2005 $41.6 $7.7 $1,543.4 $69.9 $1.6 $73.2 $1,876.5 $3.6 $219.1 $5.9 $3,842.5
2004 $41.2 $4.3 $1,138.3 $45.7 $1.3 $62.9 $1,579.9 $3.2 $194.3 $7.3 $3,078.2
2003 $42.1 $5.1 $865.7 $45.0 $0.8 $59.6 $1,316.3 $2.9 $183.6 $3.4 $2,524.5
2002 $23.0 $5.0 $681.4 $47.1 $0.3 $59.5 $1,182.0 $3.0 $169.7 $2.6 $2,173.7
2001 $24.3 $4.8 $746.2 $37.5 $1.0 $55.3 $1,231.6 $3.7 $149.4 $3.2 $2,257.0
2000 $29.5 $3.5 $853.2 $47.2 $0.8 $57.1 $1,287.0 $2.3 $146.6 $3.5 $2,430.5
1999 $38.7 $3.2 $732.9 $36.2 $0.3 $57.6 $931.0 $2.5 $99.0 $1.3 $1,902.6
1998 $28.6 $2.6 $689.6 $21.4 $0.6 $53.0 $867.3 $2.7 $85.1 $1.9 $1,752.8
1997 $33.0 $4.2 $741.5 $28.0 $0.8 $51.6 $995.0 $3.4 $101.5 $1.8 $1,960.9
1996 $36.7 $3.5 $774.9 $27.9 $0.7 $48.4 $1,017.7 $3.6 $123.8 $3.1 $2,040.2
1995 $20.2 $3.2 $587.1 $22.7 $0.5 $50.1 $928.0 $4.0 $79.6 $1.8 $1,697.3
1994 $19.9 $3.0 $582.3 $28.1 $0.7 $50.9 $869.4 $4.2 $80.4 $2.8 $1,641.7
1993 $15.5 $3.0 $563.8 $27.8 $0.8 $50.2 $859.6 $3.2 $74.9 $3.9 $1,602.7
1992 $15.6 $3.5 $566.7 $30.7 $0.7 $49.6 $857.6 $3.8 $90.2 $2.3 $1,620.8
1991 $29.9 $3.7 $542.6 $33.1 $0.7 $48.8 $882.0 $2.4 $94.4 $2.5 $1,640.0
1990 $29.0 $3.9 $562.3 $50.0 $1.9 $49.8 $920.2 $7.4 $98.2 $3.6 $1,726.2

Return to top of page

Nebraska Petroleum
Average Annual Expenditures
by Product
1970 – 1989

(Million Nominal Dollars)

Year Asphalt
& Road Oil
Aviation
Gasoline
Distillate
Fuel
Jet Fuel Kero­sene Lubri­cants Motor
Gasoline
Other
Petroleum1
Propane Residual
Fuel
Annual
Total
1989 $23.2 $3.9 $473.6 $37.1 $0.7 $44.4 $814.6 $8.9 $103.0 $4.8 $1,514.2
1988 $29.7 $3.6 $462.0 $34.2 $2.1 $41.6 $705.4 $6.1 $92.3 $5.6 $1,382.5
1987 $31.7 $3.4 $442.6 $32.9 $3.0 $40.4 $711.9 $6.7 $83.4 $4.2 $1,360.4
1986 $24.9 $5.0 $393.2 $32.8 $4.8 $37.8 $679.4 $6.6 $66.2 $4.3 $1,254.9
1985 $15.8 $4.9 $470.8 $45.9 $3.2 $39.0 $901.4 $5.6 $68.9 $1.7 $1,557.2
1984 $20.8 $5.5 $474.4 $49.3 $3.8 $41.8 $896.6 $5.5 $49.7 $2.0 $1,549.5
1983 $21.5 $6.3 $459.0 $53.9 $3.3 $37.6 $904.3 $5.9 $117.4 $2.9 $1,612.1
1982 $21.8 $6.8 $380.8 $57.2 $3.7 $35.6 $1,027.3 $6.0 $109.1 $5.1 $1,653.4
1981 $24.5 $11.7 $362.4 $60.9 $3.7 $40.7 $1,095.0 $6.8 $87.6 $1.7 $1,695.0
1980 $18.6 $9.7 $332.7 $56.2 $2.0 $33.9 $1,008.9 $3.3 $96.7 $4.3 $1,566.2
1979 $14.0 $5.2 $317.5 $42.3 $1.4 $27.0 $796.6 $2.6 $75.4 $9.8 $1,291.9
1978 $23.5 $4.5 $225.4 $31.9 $8.9 $19.2 $638.0 $2.2 $75.2 $13.0 $1,041.7
1977 $15.0 $3.7 $185.6 $26.2 $10.2 $16.4 $606.3 $1.7 $87.2 $11.9 $964.3
1976 $7.7 $2.5 $158.2 $21.1 $10.4 $23.4 $573.0 $1.8 $86.2 $15.9 $900.3
1975 $10.3 $2.5 $117.9 $19.3 $8.2 $22.3 $516.3 $1.4 $68.0 $11.2 $777.5
1974 $11.6 $2.8 $113.2 $15.8 $8.5 $22.7 $457.5 $1.4 $60.0 $10.1 $703.8
1973 $5.1 $2.0 $69.4 $8.5 $6.7 $17.5 $352.8 $1.4 $52.9 $2.9 $519.2
1972 $5.1 $1.0 $53.4 $7.4 $5.4 $16.1 $321.3 $1.0 $36.9 $3.0 $450.6
1971 $6.1 $2.2 $43.9 $7.8 $4.7 $14.2 $303.0 $0.9 $32.5 $2.0 $417.3
1970 $5.3 $2.2 $41.4 $7.3 $3.9 $14.8 $294.4 $0.0 $34.1 $2.3 $405.7

Return to top of page

Sources: State Energy Price and Expenditure Report. Energy Information Administration, Washington, DC. Nebraska Department of Environment and Energy, Lincoln, NE.

Notes: Totals may not equal the sum of the components due to independent rounding.

1Other petroleum is the subtotal of sixteen (16) petroleum products consumed in the industrial sector.

The table and graph were updated on January 9, 2024.
Typically, there are one to two years between updates.

Return to top of page