Nebraska Department of Environment and Energy

Air Water Land Energy

Nebraska Energy Statistics

Crude Oil Wellhead Prices in
Nebraska

The average wellhead price of crude oil decreased $1.60 to $70.71 in February 2023 from January 2023. February's monthly average price was $15.17 lower than the average price of $85.88 in the same month last year. The record high monthly average was set in June 2008 at $123.77 per barrel. The record low monthly average was set in December 1998 at $8.63 per barrel.
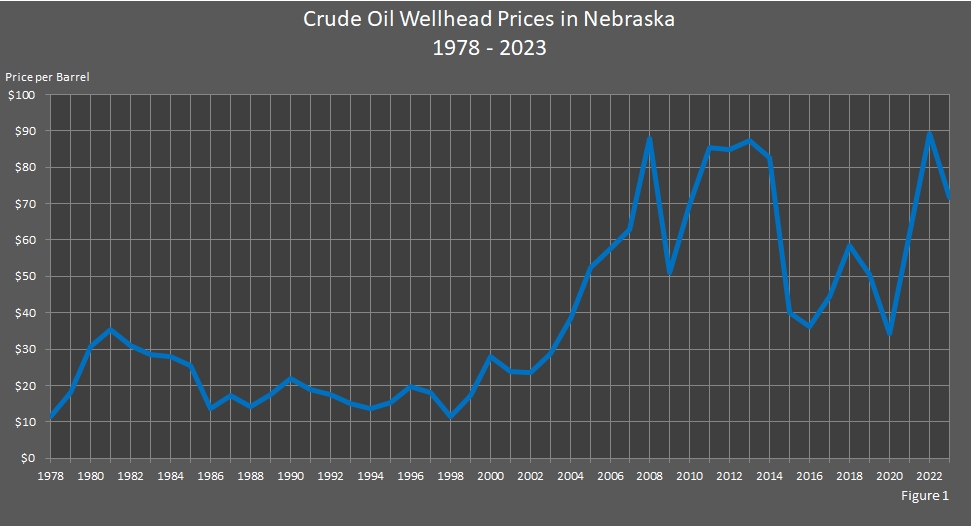
The annual average price of $89.20 for 2022 was an increase of $27.31 from $61.89 in 2021. Although the annual average of $87.44 for 2013 was within cents of the record high of $87.99 set in 2008, the annual average for 2008 remains the record high rising above the previous records set each year from 2004 to 2008. Before 2004, the record high had been $35.32 set in 1981.

The annual average record low was set in 1978 at $11.40 per barrel. In earlier years, the record low could have been lower, but 1978 is the earliest data recorded.

Return to top of page

chart showing crude oil wellhead prices in Nebraska.

Return to top of page

Nebraska Crude Oil Wellhead Prices
2000 – 2023

(Price per Barrel)

Year Jan Feb Mar Apr May Jun Jul Aug Sep Oct Nov Dec Annual Average
2023 $72.31 $70.71 NA NA NA NA NA NA NA NA NA NA NA
2022 $77.04 $85.88 $103.23 $96.65 $104.02 $108.96 $94.67 $86.65 $78.36 $81.24 $78.82 $71.02 $89.20
2021 $45.56 $52.69 $56.27 $55.40 $58.80 $65.14 $66.47 $61.65 $65.23 $75.06 $72.34 $65.83 $61.89
2020 $51.24 $44.16 $24.22 $11.81 $20.50 $31.58 $34.28 $35.92 $33.41 $32.98 $34.81 $40.68 $34.39
2019 $44.76 $48.29 $51.56 $57.32 $54.59 $48.31 $50.99 $48.39 $50.28 $47.53 $50.64 $53.36 $50.50
2018 $57.40 $56.04 $56.78 $60.07 $63.82 $61.12 $64.67 $61.78 $63.95 $64.63 $50.76 $42.05 $58.61
2017 $46.07 $46.62 $42.85 $44.63 $42.24 $38.87 $40.40 $41.48 $43.07 $45.39 $50.32 $51.77 $44.33
2016 $24.26 $22.83 $30.58 $33.70 $39.61 $41.46 $38.24 $38.28 $38.34 $43.19 $38.97 $45.28 $36.22
2015 $38.30 $41.18 $38.20 $44.71 $50.24 $50.61 $42.47 $34.32 $36.84 $37.90 $34.62 $29.31 $40.10
2014 $84.18 $90.17 $90.36 $91.86 $91.55 $94.73 $91.99 $85.04 $82.14 $73.64 $64.88 $49.51 $82.72
2013 $84.27 $84.92 $82.76 $81.59 $84.60 $85.44 $94.09 $96.29 $96.19 $89.86 $82.65 $86.83 $87.44
2012 $91.60 $93.78 $96.68 $93.67 $85.61 $72.46 $77.67 $83.63 $84.36 $79.13 $76.17 $77.88 $84.95
2011 $79.99 $80.01 $92.96 $100.36 $91.70 $86.35 $87.56 $76.27 $75.86 $76.79 $87.43 $89.91 $85.48
2010 $67.91 $66.26 $71.07 $74.61 $64.44 $65.23 $66.14 $66.76 $65.60 $72.14 $74.34 $79.61 $69.65
2009 $30.02 $27.79 $37.28 $40.09 $48.80 $59.28 $54.08 $60.73 $58.87 $65.63 $67.58 $64.43 $50.93
2008 $81.98 $84.47 $93.84 $102.39 $115.20 $123.77 $123.47 $105.54 $92.37 $64.64 $45.39 $28.96 $87.99
2007 $44.22 $49.64 $50.84 $54.55 $53.95 $57.70 $64.66 $62.96 $69.58 $76.15 $85.11 $81.64 $62.78
2006 $61.44 $57.22 $56.48 $61.19 $61.44 $61.62 $65.40 $64.08 $54.27 $48.58 $48.41 $51.56 $57.77
2005 $41.53 $43.11 $50.08 $48.06 $45.05 $50.87 $53.66 $60.00 $60.67 $58.51 $54.61 $55.46 $52.38
2004 $31.35 $31.80 $34.10 $33.82 $37.29 $35.09 $37.37 $41.76 $43.06 $50.24 $46.06 $38.87 $38.42
2003 $30.36 $33.28 $30.88 $25.98 $25.88 $28.12 $28.50 $29.32 $26.00 $28.02 $28.31 $29.53 $28.63
2002 $16.98 $17.97 $21.66 $23.67 $24.44 $23.25 $24.48 $25.47 $27.36 $26.43 $24.36 $27.08 $23.62
2001 $27.39 $27.60 $24.36 $24.82 $25.89 $24.46 $23.98 $24.77 $24.63 $19.66 $19.26 $16.95 $23.67
2000 $24.70 $27.25 $28.07 $23.61 $26.56 $28.86 $27.78 $28.88 $30.80 $30.42 $32.14 $26.36 $27.97

Return to top of page

Nebraska Crude Oil Wellhead Prices
1978 – 1999

(Price per Barrel)

Year Jan Feb Mar Apr May Jun Jul Aug Sep Oct Nov Dec Annual Average
1999 $9.81 $9.35 $12.33 $14.96 $15.61 $15.77 $17.94 $19.03 $21.50 $20.40 $22.77 $23.81 $17.21
1998 $13.84 $13.15 $12.09 $12.47 $11.86 $10.36 $10.77 $10.22 $11.79 $11.24 $9.70 $8.63 $11.50
1997 $22.93 $19.88 $18.50 $17.40 $18.37 $16.55 $16.94 $17.11 $17.74 $18.52 $17.29 $15.47 $18.10
1996 $15.91 $15.79 $18.04 $20.25 $18.94 $18.27 $19.06 $19.72 $21.99 $22.78 $21.38 $22.79 $19.57
1995 $14.60 $15.33 $15.15 $16.63 $16.44 $15.27 $14.08 $14.71 $14.95 $14.15 $14.77 $16.06 $15.18
1994 $11.19 $10.92 $10.88 $12.67 $14.52 $15.76 $16.32 $14.81 $13.91 $14.22 $14.55 $13.65 $13.60
1993 $15.93 $16.88 $16.95 $16.91 $16.28 $15.40 $14.10 $14.18 $13.58 $14.26 $12.87 $10.77 $14.90
1992 $16.18 $16.19 $16.08 $17.19 $17.92 $19.22 $18.56 $18.18 $18.79 $18.63 $17.26 $16.31 $17.51
1991 $21.77 $17.96 $17.29 $18.30 $18.48 $17.52 $18.83 $18.99 $19.25 $20.63 $19.72 $16.82 $18.78
1990 $20.00 $19.72 $18.19 $16.18 $15.95 $14.37 $16.03 $24.48 $30.88 $33.21 $29.46 $24.47 $21.94
1989 $15.71 $15.86 $17.45 $18.68 $18.09 $18.05 $17.87 $16.25 $17.11 $17.78 $17.41 $18.32 $17.36
1988 $15.27 $14.89 $14.53 $15.72 $15.87 $15.03 $13.76 $13.64 $13.17 $12.11 $11.93 $13.74 $14.08
1987 $15.80 $16.22 $16.14 $16.34 $17.01 $17.62 $18.63 $18.58 $17.61 $17.63 $17.25 $16.11 $17.08
1986 $24.26 $17.06 $12.85 $11.44 $12.20 $12.28 $10.35 $11.99 $13.15 $12.73 $12.65 $13.30 $13.70
1985 $24.82 $24.41 $24.70 $25.10 $25.47 $25.44 $25.38 $25.38 $25.61 $25.93 $26.30 $26.54 $25.42
1984 NA NA NA NA NA NA NA NA NA NA NA NA $27.83
1983 NA NA NA NA NA NA NA NA NA NA NA NA $28.58
1982 NA NA NA NA NA NA NA NA NA NA NA NA $30.98
1981 NA NA NA NA NA NA NA NA NA NA NA NA $35.32
1980 NA NA NA NA NA NA NA NA NA NA NA NA $30.60
1979 NA NA NA NA NA NA NA NA NA NA NA NA $18.13
1978 NA NA NA NA NA NA NA NA NA NA NA NA $11.40

Return to top of page

Sources: Petroleum Marketing Monthly. Energy Information Administration, Washington, DC. Nebraska Department of Environment and Energy, Lincoln, NE.

Notes: NA = Not Available. Numbers in red have been revised.

The table was updated on May 11, 2023. Typically, there is one month between table updates.
The graph was updated on March 15, 2023. Typically, there is one year between graph updates.

Return to top of page