Nebraska Department of Environment and Energy

Air Water Land Energy

Nebraska Energy Statistics

Nebraska's
Petroleum Consumption
by Product

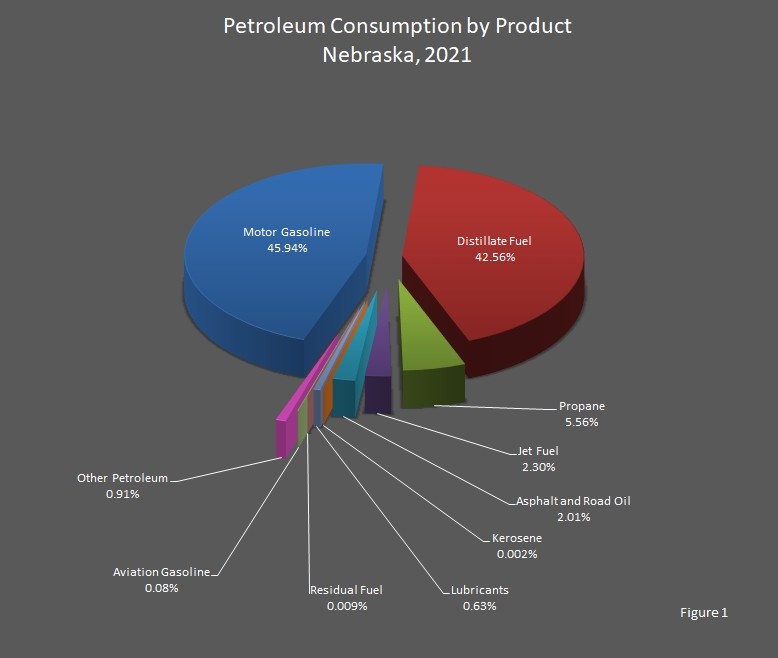
Petroleum use in Nebraska for 2021 was 46,347 thousand barrels (46.3 million barrels), an increase of 4.0 percent from 2020. A new record was set in 2019 at 47,541 thousand barrels (47.5 million barrels).

Figure 1 shows that motor gasoline and distillate fuel (diesel fuel and heating oil) made up nearly equal slices of the pie resulting in 88.5 percent of the total petroleum products consumed in 2021. Propane made up 6 percent, jet fuel made up 2 percent, and asphalt and road oil made up 2 percent. Each of the other fuels' consumption was less than 1 percent of the pie.

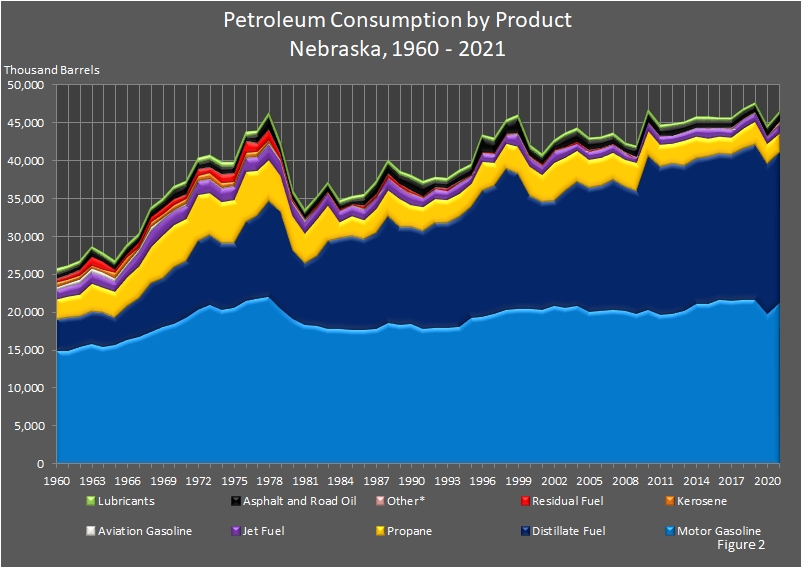
Figure 2 shows, over the last sixty–one years, people have consumed more motor gasoline than any of the other petroleum products, with distillate fuel running a close second.

Return to top of page

chart showing Petroleum Consumption in Nebraska by product.

Return to top of page

chart showing Petroleum Consumption in Nebraska by product.

Return to top of page

Petroleum Consumption by Product,
Nebraska, 2020 – 2021

(Thousand Barrels)

Year Asphalt
and
Road
Oil
Aviation
Gasoline
Distillate
Fuel Oil
Jet
Fuel
Kerosene Lubri­cants Motor
Gasoline
Other
Petro–
leum 1
Propane Residual
Fuel
Total
2021 931 35 19,724 1,068 1 290 21,293 424 2,576 4 46,347
2020 942 36 19,729 867 1 272 19,875 154 2,693 3 44,571

Return to top of page

Petroleum Consumption by Product,
Nebraska, 2000 – 2019

(Thousand Barrels)

Year Asphalt
and
Road
Oil
Aviation
Gasoline
Distillate
Fuel Oil
Jet
Fuel
Kerosene Lubri­cants Motor
Gasoline
Other
Petro–
leum 1
Propane Residual
Fuel
Total
2019 772 37 20,445 1,158 2 291 21,717 163 2,951 3 47,539
2018 860 38 19,940 800 1 293 21,677 179 2,567 6 46,360
2017 974 39 19,345 739 1 297 21,526 178 2,132 1 45,712
2016 875 37 19,316 603 2 323 21,615 110 2,312 0 45,806
2015 953 34 19,374 749 1 335 21,146 109 2,343 0 45,438
2014 929 38 19,161 577 2 308 21,133 109 2,771 1 45,532
2013 922 35 19,070 702 1 295 20,282 104 3,297 0 45,078
2012 1,139 44 19,832 574 1 279 19,813 37 2,632 1 44,679
2011 1,017 46 19,486 596 2 303 19,733 37 2,910 1 44,361
2010 1,141 49 20,350 605 5 320 20,361 39 3,236 1 46,325
2009 1,096 63 16,139 697 7 288 19,926 188 3,727 8 41,928
2008 810 66 16,374 888 5 320 20,217 230 3,503 81 42,302
2007 904 79 17,242 968 9 345 20,336 263 3,537 70 43,528
2006 1,053 80 16,534 1,060 8 334 20,163 277 3,762 77 43,115
2005 1,216 82 16,299 934 18 342 20,148 276 3,768 145 42,990
2004 1,301 56 16,435 918 22 344 20,840 298 4,039 231 44,222
2003 1,336 81 14,954 1,205 16 340 20,673 268 4,328 142 43,564
2002 803 93 13,936 1,527 7 368 20,846 257 4,943 124 42,685
2001 856 86 14,207 1,113 21 372 20,392 256 3,615 127 40,831
2000 937 64 14,937 1,231 15 406 20,457 19 3,830 142 42,038

Return to top of page

Petroleum Consumption by Product,
Nebraska, 1980 – 1999

(Thousand Barrels)

Year Asphalt
and
Road
Oil
Aviation
Gasoline
Distillate
Fuel Oil
Jet
Fuel
Kerosene Lubri­cants Motor
Gasoline
Other
Petro–
leum 1
Propane Residual
Fuel
Total
1999 1,867 71 17,754 1,564 11 412 20,487 22 3,665 77 45,930
1998 1,400 63 18,646 1,081 23 408 20,305 24 3,300 116 45,366
1997 1,450 90 16,848 1,075 23 390 19,825 25 3,130 110 42,966
1996 1,771 75 16,644 1,007 19 369 19,474 28 3,831 167 43,386
1995 929 77 14,599 1,001 17 380 19,302 31 3,020 121 39,475
1994 1,031 76 14,595 1,259 21 387 18,043 31 3,080 212 38,734
1993 797 72 13,847 1,157 24 370 18,029 30 2,984 275 37,586
1992 898 81 13,848 1,198 20 363 17,951 28 3,225 185 37,797
1991 1,418 84 12,949 1,192 17 356 17,801 26 3,167 199 37,211
1990 1,388 83 12,848 1,501 41 398 18,451 316 2,912 257 38,196
1989 1,130 93 12,894 1,488 22 387 18,427 286 3,622 373 38,722
1988 1,262 96 14,121 1,505 76 377 18,609 290 3,500 412 40,247
1987 1,241 90 12,606 1,373 104 391 17,885 282 3,218 265 37,455
1986 954 117 12,024 1,353 168 346 17,757 277 2,449 252 35,698
1985 473 96 12,411 1,357 74 354 17,737 75 2,590 62 35,229
1984 631 107 12,003 1,385 88 380 17,871 74 2,118 70 34,726
1983 668 119 11,547 1,482 76 356 17,905 74 4,818 105 37,150
1982 736 123 9,253 1,453 93 340 18,261 68 4,788 191 35,308
1981 671 214 8,200 1,466 87 373 18,333 151 4,023 70 33,588
1980 719 213 9,149 1,588 62 389 19,100 130 4,499 228 36,076

Return to top of page

Petroleum Consumption by Product,
Nebraska, 1960 – 1979

(Thousand Barrels)

Year Asphalt
and
Road
Oil
Aviation
Gasoline
Distillate
Fuel Oil
Jet
Fuel
Kerosene Lubri­cants Motor
Gasoline
Other
Petro–
leum 1
Propane Residual
Fuel
Total
1979 817 181 12,862 1,900 57 437 20,478 133 4,682 707 42,254
1978 1,606 207 12,630 1,989 456 418 22,075 146 5,469 1,266 46,260
1977 1,098 183 10,916 1,771 559 389 21,810 147 5,922 1,088 43,882
1976 570 138 10,426 1,692 635 547 21,580 155 6,552 1,505 43,800
1975 754 141 8,507 1,679 554 492 20,636 150 5,740 1,092 39,745
1974 976 174 8,847 1,797 623 519 20,412 150 5,289 1,049 39,836
1973 884 172 9,307 1,665 782 542 20,948 156 5,593 670 40,719
1972 889 89 9,097 1,721 771 476 20,414 145 6,006 720 40,329
1971 1,111 197 7,613 1,812 680 445 19,231 137 5,468 579 37,273
1970 1,137 199 7,449 1,783 582 479 18,525 102 5,616 793 36,665
1969 741 233 6,439 2,038 526 470 18,082 109 5,669 779 35,087
1968 787 556 6,454 2,124 638 467 17,451 81 4,705 643 33,907
1967 606 333 5,172 1,849 348 425 16,763 54 4,262 586 30,397
1966 714 362 4,464 1,510 722 442 16,412 43 3,818 430 28,917
1965 655 410 3,689 1,371 790 425 15,745 50 3,407 332 26,875
1964 654 443 4,659 1,530 496 401 15,422 45 3,255 983 27,888
1963 843 428 4,351 1,491 457 382 15,893 47 3,672 1,161 28,725
1962 705 423 4,080 1,463 610 382 15,486 60 2,953 666 26,827
1961 702 416 4,462 1,309 622 413 14,965 61 2,730 496 26,176
1960 780 371 4,151 1,202 677 424 14,998 62 2,650 415 25,731

Return to top of page

Sources: State Energy Data Report. Energy Information Administration, Washington, DC. Nebraska Department of Environment and Energy, Lincoln, NE.

Notes: Totals may not equal the sum of the components due to independent rounding. Numbers in red have been revised.

1 Other petroleum is the subtotal of sixteen (16) petroleum products consumed in the industrial sector.

The table and graphs were updated on January 9, 2024.
Typically, there are one to two years between updates.

Return to top of page