Nebraska Department of Environment and Energy

Air Water Land Energy

Nebraska Energy Statistics

Nebraska's Dry Natural Gas
Proven Reserves

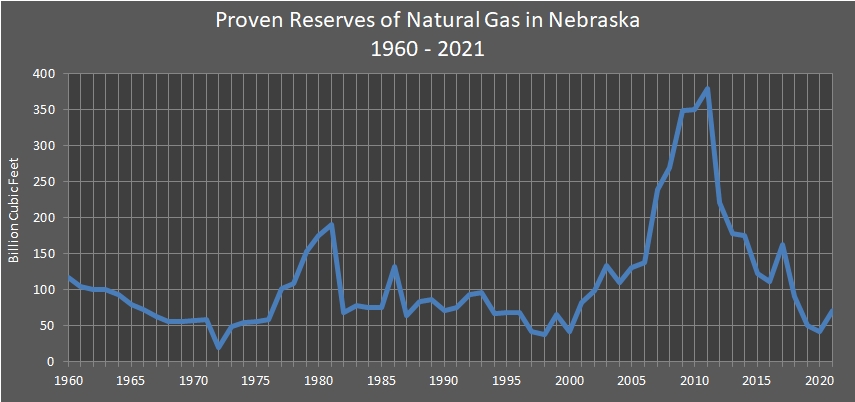
The estimated quantity of natural gas which geological and engineering data demonstrate with a given probability to be recoverable in the future assuming current costs of operation and market prices are proven reserves. Nebraska's dry natural gas reserves are given for the years 1960 to 2021 in the table below.

Proven reserves for Nebraska peaked in 1960 at 117.8 billion cubic feet. Beginning in 1977, Nebraska's reserves have been included with a group of miscellaneous states, including Arizona, Florida, Idaho, Illinois, Indiana, Maryland, Missouri, Nevada, Oregon, South Dakota, and Tennessee. Individual state volumes are withheld for these states to avoid disclosure of operator–level reserves data or because of other statistical prevision or data quality reasons. Proven reserves for this group of miscellaneous states peaked in 2011 at 379 billion cubic feet. Prior to 2011, the previous four years had also surpassed the peak reached in 1981 at 191 billion cubic feet.

Return to top of page

line chart representing Dry Natural Gas Proven Reserves in Nebraska between 1960 and 2015.

Return to top of page

Nebraska Dry Natural Gas Proven Reserves
1960 – 2021

(Billion Cubic Feet at 14.73 psia and 60 Degrees Fahrenheit
as of December 31)

Year Proven
Reserves
Year Proven
Reserves
Year Proven
Reserves
Year Proven
Reserves
Year Proven
Reserves
Year Proven
Reserves
Year Proven
Reserves
1960 117.8 1970 58.2 1980 176.0 1990 72.0 2000 42.0 2010 350.0 2020 42.0
1961 104.3 1971 59.4 1981 191.0 1991 76.0 2001 82.0 2011 379.0 2021 72.0
1962 100.7 1972 50.3 1982 69.0 1992 93.0 2002 99.0 2012 222.0 2022 NA
1963 100.0 1973 48.8 1983 78.0 1993 96.0 2003 134.0 2013 179.0 2023 NA
1964 93.4 1974 54.6 1984 75.0 1994 67.0 2004 110.0 2014 176.0 2024 NA
1965 79.6 1975 55.8 1985 76.0 1995 69.0 2005 131.0 2015 123.0 2025 NA
1966 72.8 1976 59.2 1986 133.0 1996 69.0 2006 138.0 2016 112.0 2026 NA
1967 63.8 1977 102.0 1987 65.0 1997 43.0 2007 239.0 2017 163.0 2027 NA
1968 56.8 1978 109.0 1988 84.0 1998 38.0 2008 270.0 2018 91.0 2028 NA
1969 56.6 1979 153.0 1989 87.0 1999 66.0 2009 349.0 2019 50.0 2029 NA

Return to top of page

Sources: U.S. Crude Oil and Natural Gas Proved Reserves. Energy Information Administration, Washington, DC. Nebraska Department of Environment and Energy, Lincoln, NE.

This table was updated on January 23, 2023.
Typically, there is one year between updates.

Return to top of page