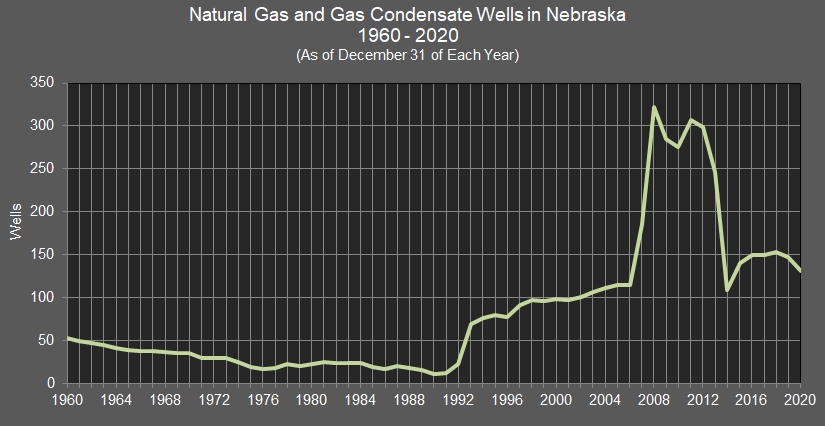
Nebraska Department of Environment and Energy

Air Water Land Energy

Nebraska Energy Statistics

Natural Gas and Gas Condensate Wells in
Nebraska

Return to top of page

line chart representing Natural Gas and Gas Condensate Wells in Nebraska.

Return to top of page

Nebraska Natural Gas and Gas Condensate Wells

2020

Year Natural Gas
&
Gas Condensate
Wells
Year Natural Gas
&
Gas Condensate
Wells
Year Natural Gas
&
Gas Condensate
Wells
2020 131 2030 NA 2040 NA
2021 NA 2031 NA 2041 NA
2022 NA 2032 NA 2042 NA
2023 NA 2033 NA 2043 NA
2024 NA 2034 NA 2044 NA
2025 NA 2035 NA 2045 NA
2026 NA 2036 NA 2046 NA
2027 NA 2037 NA 2047 NA
2028 NA 2038 NA 2048 NA
2029 NA 2039 NA 2049 NA

Return to top of page

Nebraska Natural Gas and Gas Condensate Wells

1990 – 2019

Year Natural Gas
&
Gas Condensate
Wells
Year Natural Gas
&
Gas Condensate
Wells
Year Natural Gas
&
Gas Condensate
Wells
1990 11 2000 98 2010 276
1991 12 2001 96 2011 307
1992 22 2002 106 2012 299
1993 59 2003 109 2013 246
1994 87 2004 111 2014 109
1995 87 2005 114 2015 140
1996 88 2006 114 2016 149
1997 91 2007 186 2017 150
1998 95 2008 322 2018 153
1999 96 2009 285 2019 147

Return to top of page

Nebraska Natural Gas and Gas Condensate Wells

1960 – 1989

Year Natural Gas
&
Gas Condensate
Wells
Year Natural Gas
&
Gas Condensate
Wells
Year Natural Gas
&
Gas Condensate
Wells
1960 53 1970 35 1980 22
1961 49 1971 29 1981 25
1962 47 1972 29 1982 23
1963 44 1973 29 1983 23
1964 41 1974 25 1984 23
1965 39 1975 19 1985 19
1966 37 1976 17 1986 16
1967 37 1977 18 1987 20
1968 36 1978 22 1988 18
1969 35 1979 20 1989 15

Return to top of page

Sources: Energy Information Administration, Washington, DC. Nebraska Department of Environment and Energy, Lincoln, NE.

The table and graph were updated on January 13, 2022.

Return to top of page