Nebraska Department of Environment and Energy

Air Water Land Energy

Nebraska Energy Statistics

Natural Gas Production by County
in Nebraska

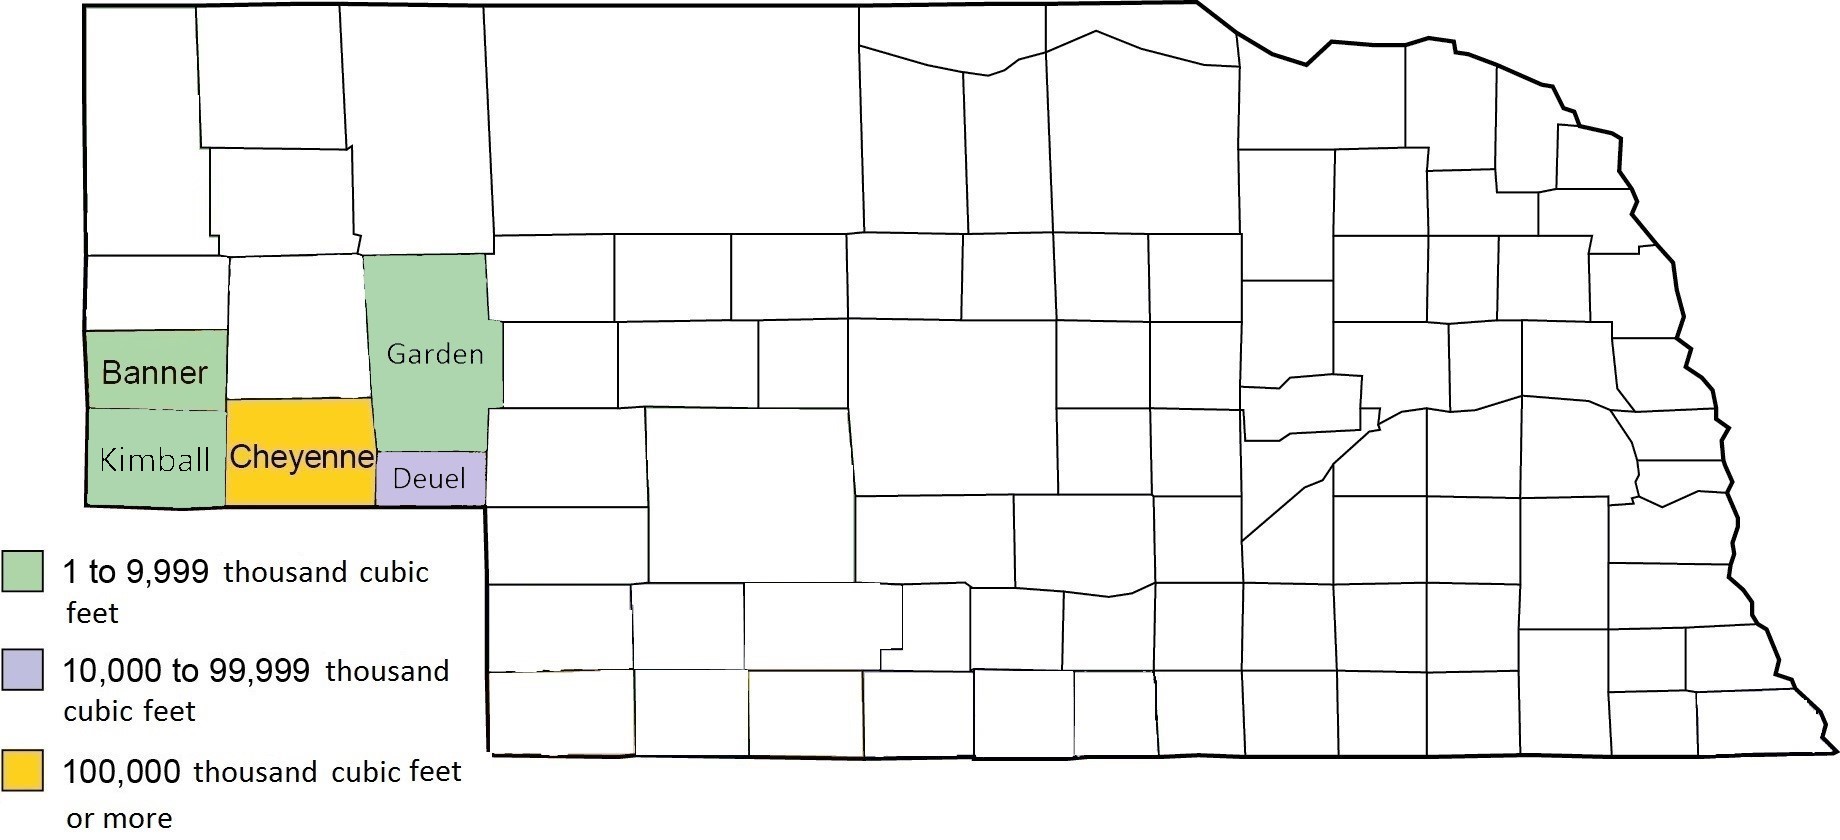
Nebraska's production by county is visually represented by the map below. Historical numbers follow in the data table. Totals can be viewed in the report Natural Gas Production.

Natural gas production has been falling since 2008, which was the year that natural gas production peaked at 3,083,488 thousand cubic feet and the price of natural gas began decreasing. Starting in 2014, natural gas production has been relatively stable.

In 2013, Cheyenne County took over being the leader of all the counties in natural gas production. From 2008 to 2012, Chase County had been the leader.

Return to top of page

Nebraska 2022 Natural Gas Production
by County

Natural Gas Production by County in Nebraska.

Return to top of page

Nebraska Natural Gas Production
by County
1984 – 2022

(Thousand Cubic Feet)

Year Banner Chase Cheyenne Deuel Dundy Garden Kimball Morrill Perkins Scotts
Bluff
Sioux Total
2022 2,344 0 296,118 19,576 0 330 1,920 0 0 0 0 320,288
2021 2,392 0 285,653 37,793 0 950 0 0 0 0 0 326,788
2020 3,150 0 289,801 38,775 0 2,110 14,276 0 0 0 0 348,112
2019 3,414 0 299,078 49,152 0 1,415 28,615 0 0 0 0 381,674
2018 3,068 0 321,434 72,103 0 2,301 32,564 0 0 0 0 431,470
2017 3,691 0 308,560 99,002 0 650 42,818 0 0 0 0 454,721
2016 3,849 0 351,456 106,854 0 21,477 42,784 0 0 0 0 526,420
2015 4,124 0 331,234 67,191 0 0 73,146 480 0 0 0 476,175
2014 5,973 0 335,853 2,890 0 2,053 54,407 400 0 0 0 401,576
2013 4,078 320,161 421,124 7,070 133,263 5,171 57,924 937 0 0 0 949,694
2012 4,197 480,089 458,357 116,469 153,709 16,947 56,796 2,365 0 0 0 1,288,929
2011 4,355 603,396 529,255 532,519 175,919 36,864 93,451 4,090 0 0 0 1,979,849
2010 4,397 812,464 520,755 553,904 199,067 43,698 118,886 385 0 0 0 2,253,556
2009 5,805 1,142,226 618,828 628,746 271,835 96,389 128,413 2,458 21,687 0 0 2,916,387
2008 6,427 855,519 731,838 830,118 269,830 157,129 159,025 5,233 68,369 0 0 3,083,488
2007 7,395 257,894 659,191 383,265 13,834 19,824 172,894 3,563 41,704 0 0 1,559,564
2006 7,833 0 805,559 260,509 8,202 13,882 115,691 5,463 0 311 0 1,217,450
2005 10,675 0 689,384 320,028 10,152 24,013 137,498 7,815 0 1,360 0 1,200,925
2004 16,132 0 800,001 471,127 18,138 35,305 146,721 8,541 0 2,815 0 1,498,780
2003 16,448 0 813,386 437,076 9,833 27,603 155,505 8,167 0 2,770 0 1,470,788
2002 16,832 0 785,205 183,276 488 41,645 152,690 9,650 0 2,813 0 1,192,599
2001 19,064 0 790,591 194,837 427 18,384 172,769 10,100 0 2,858 0 1,209,030
2000 50,958 0 812,290 188,502 461 120 183,001 10,742 0 2,346 0 1,218,420
1999 19,845 0 1,004,568 191,807 415 0 167,695 10,644 0 1,870 0 1,396,844
1998 24,562 0 1,245,899 208,518 537 820 0 12,019 0 3,399 0 1,495,754
1997 27,825 0 1,329,949 56,702 516 1,920 234,651 13,401 0 4,721 0 1,669,685
1996 29,784 0 1,493,477 4,626 527 34,842 290,878 16,389 0 5,474 0 1,875,997
1995 31,747 0 1,762,869 0 542 39,346 381,865 18,825 0 4,703 0 2,239,897
1994 32,478 0 2,401,085 0 278 0 438,491 20,736 0 5,269 0 2,898,337
1993 33,539 0 1,642,768 0 0 0 407,847 25,178 0 4,914 0 2,114,246
1992 37,919 0 800,134 0 316 0 302,677 24,797 0 6,444 4,214 1,176,501
1991 43,546 0 424,242 0 910 0 278,240 22,751 0 5,705 8,109 783,503
1990 43,922 0 443,997 0 868 0 266,329 24,902 0 4,207 8,917 793,142
1989 42,152 0 477,798 0 1,036 0 326,149 17,674 0 4,454 9,254 878,517
1988 57,074 0 531,539 282 933 0 290,461 17,735 0 3,889 8,555 910,468
1987 79,174 0 722,013 1,642 448 0 429,122 19,813 0 4,432 3,896 1,260,540
1986 91,632 0 941,395 8,569 106 0 334,349 20,881 0 4,382 2,171 1,403,485
1985 144,777 0 1,378,244 11,785 0 0 384,316 20,251 0 5,196 0 1,944,569
1984 160,551 0 1,605,710 15,767 0 0 481,755 27,588 0 6,243 784 2,298,398

Return to top of page

Sources: "Nebraska Oil Activity Summary." Nebraska Oil and Gas Conservation Commission, Sidney, NE. Nebraska Department of Environment and Energy, Lincoln, NE.

Notes: The production numbers include dry gas and casinghead production. Totals may not match annual production numbers. The annual production numbers are the final numbers.

The table and map were updated on February 13, 2024.
Typically, there is one year between updates.

Return to top of page