Nebraska Department of Environment and Energy

Air Water Land Energy

Nebraska Energy Statistics

Nebraska's
Natural Gas Expenditures
by Sector

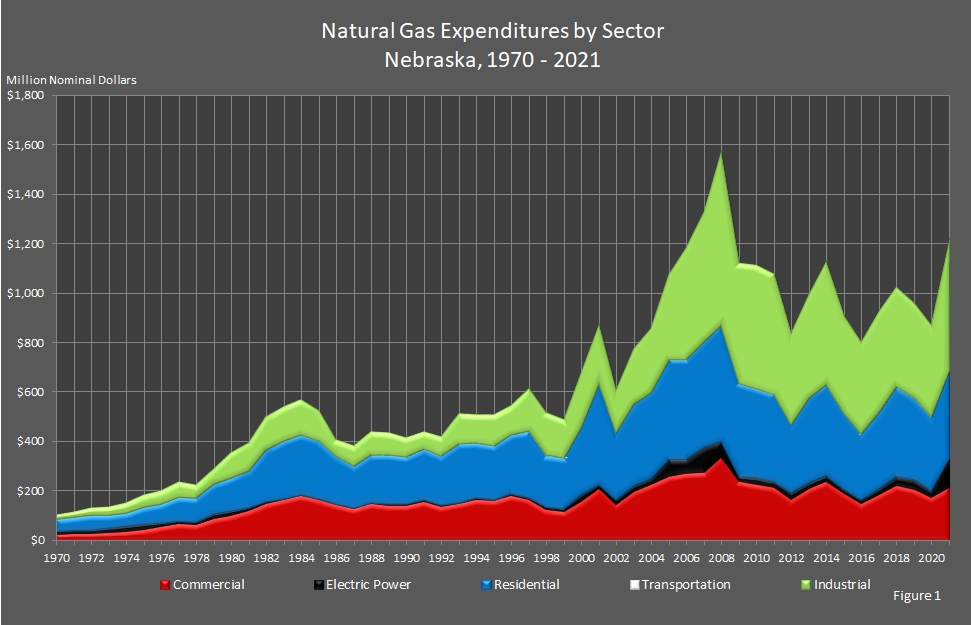
In 2021, expenditures on natural gas increased (38.7 percent) to $1,203.0 million from $867.6 million in 2020. The industrial sector spent $516.5 million (43 percent of the total spent), the residential sector spent $348.9 million (29 percent), and the commercial sector spent $212.9 million (18 percent). The electric power sector spent $118.6 million (10 percent), and the transportation sector spent $6.1 million (less than one percent of the total).

The expenditures are in nominal dollars to provide a better comparison.

Return to top of page

line chart showing Natural Gas Expenditures by Sector in Nebraska.

Return to top of page

Nebraska Natural Gas Expenditures
by Sector
2010 – 2021

(Million Nominal Dollars)

Year Sectors Annual
Total
End–Use Sectors Electric
Power
Commercial Industrial Residential Transportation
2021 $212.9 $516.5 $348.9 $6.1 $118.6 $1,203.0
2020 $172.5 $368.1 $297.5 $2.2 $27.3 $867.6
2019 $206.3 $383.0 $328.9 $2.2 $38.0 $958.5
2018 $222.0 $401.0 $361.9 $2.2 $34.7 $1,021.8
2017 $184.8 $406.4 $307.0 $1.4 $25.8 $925.5
2016 $147.0 $367.7 $264.7 $1.8 $19.2 $800.4
2015 $188.6 $390.4 $307.1 $1.1 $16.9 $904.0
2014 $235.6 $494.3 $369.6 $0.8 $24.5 $1,124.9
2013 $209.1 $416.0 $345.9 $0.9 $22.8 $994.8
2012 $164.1 $370.8 $271.6 $0.6 $30.2 $837.2
2011 $214.8 $483.2 $351.1 $0.6 $24.2 $1,073.9
2010 $226.5 $498.3 $359.2 $0.3 $28.2 $1,112.5

Return to top of page

Nebraska Natural Gas Expenditures
by Sector
1990 – 2009

(Million Nominal Dollars)

Year Sectors Annual
Total
End–Use Sectors Electric
Power
Commercial Industrial Residential Transportation
2009 $236.5 $486.9 $374.9 $0.2 $20.9 $1,119.4
2008 $334.9 $695.5 $470.6 $0.3 $64.6 $1,565.8
2007 $275.4 $523.3 $430.3 $0.2 $97.8 $1,327.1
2006 $270.2 $447.0 $405.6 $0.2 $56.9 $1,180.0
2005 $258.9 $343.1 $405.4 $0.2 $65.8 $1,073.5
2004 $226.9 $259.6 $349.7 $0.4 $21.7 $858.4
2003 $195.7 $223.4 $330.3 $0.3 $25.9 $775.6
2002 $144.0 $171.8 $270.8 $0.2 $20.6 $607.5
2001 $207.6 $235.7 $406.4 $0.3 $18.7 $868.7
2000 $157.8 $216.3 $273.3 $0.2 $25.8 $673.4
1999 $114.2 $154.6 $205.4 $0.1 $13.0 $487.4
1998 $122.9 $173.0 $209.2 $0.1 $12.4 $517.5
1997 $165.2 $171.0 $268.0 $0.9 $7.8 $612.9
1996 $182.4 $118.9 $238.8 $0.2 $4.8 $545.0
1995 $158.7 $124.9 $217.8 $0.1 $5.1 $506.6
1994 $165.0 $115.3 $222.6 $0.1 $6.2 $509.2
1993 $148.3 $119.5 $239.5 $0.1 $5.1 $512.4
1992 $137.8 $77.2 $199.5 $0.1 $4.4 $419.0
1991 $156.1 $68.3 $207.5 $0.0 $6.9 $438.8
1990 $140.7 $76.5 $190.9 $0.0 $7.3 $415.4

Return to top of page

Nebraska Natural Gas Expenditures
by Sector
1970 – 1989

(Million Nominal Dollars)

Year Sectors Annual
Total
End–Use Sectors Electric
Power
Commercial Industrial Residential Transportation
1989 $140.7 $89.2 $200.6 $0.0 $5.9 $436.5
1988 $147.7 $92.1 $194.0 $0.0 $5.2 $439.0
1987 $126.6 $83.2 $169.5 $0.0 $4.4 $383.6
1986 $142.8 $66.3 $194.0 $0.0 $5.3 $408.4
1985 $166.0 $119.4 $233.9 $0.0 $4.4 $523.7
1984 $179.0 $140.1 $243.3 $0.0 $4.8 $567.2
1983 $164.7 $138.8 $234.1 $0.0 $4.9 $542.5
1982 $150.2 $131.1 $213.6 $0.0 $4.6 $499.6
1981 $120.3 $113.6 $151.5 $0.0 $10.3 $395.7
1980 $99.1 $101.1 $133.5 $0.0 $20.5 $354.1
1979 $87.2 $61.3 $123.3 $0.0 $19.3 $291.2
1978 $62.6 $55.9 $94.8 $0.0 $13.8 $227.2
1977 $65.5 $60.9 $95.1 $0.0 $14.6 $236.1
1976 $56.2 $53.8 $75.1 $0.0 $15.5 $200.6
1975 $42.9 $49.2 $68.9 $0.0 $23.3 $184.3
1974 $34.3 $37.2 $56.3 $0.0 $23.0 $150.9
1973 $29.3 $30.5 $52.4 $0.0 $22.1 $134.4
1972 $26.5 $26.5 $59.4 $0.0 $18.2 $130.7
1971 $27.7 $19.6 $53.2 $0.0 $15.2 $115.7
1970 $24.7 $17.0 $49.6 $0.0 $12.8 $104.1

Return to top of page

Sources: State Energy Price and Expenditure Report. Energy Information Administration, Washington, DC. Nebraska Department of Environment and Energy, Lincoln, NE.

Note: Totals may not equal the sum of the components due to independent rounding.

The table and graph were updated on January 9, 2024.
Typically, there are one to two years between updates.

Return to top of page