Nebraska Department of Environment and Energy

Air Water Land Energy

Nebraska Energy Statistics

Nebraska's Natural Gas
Average Annual Prices
by Sector

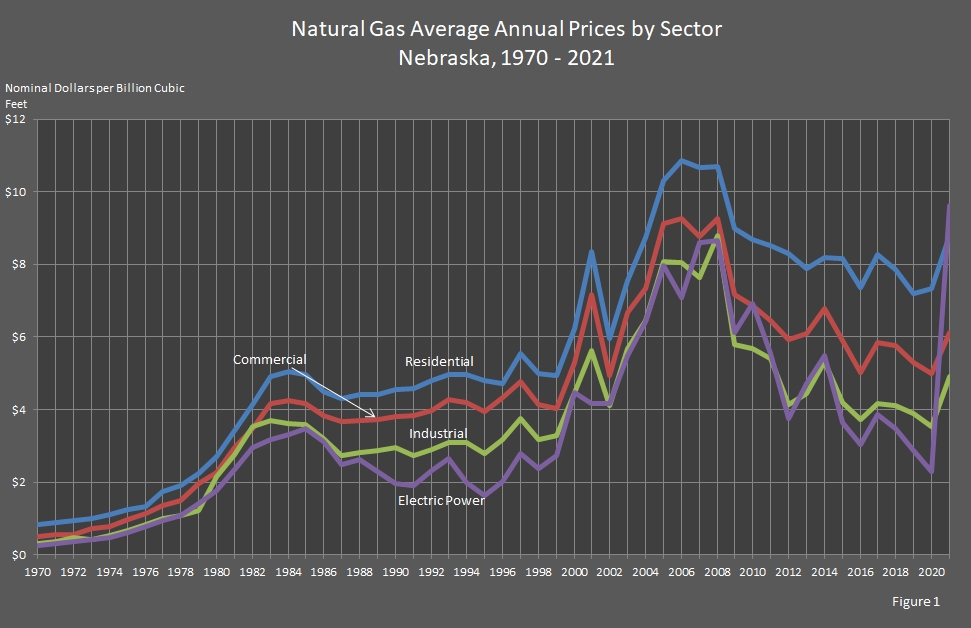
The price of natural gas has changed significantly over the last forty years reflecting its volatility or instability. The average annual prices for the residential, commercial, and industrial sectors mimicked each other's movements and kept a steady price spread. From 2019 to 2020, the electric power sector price increased 21 cents or 7.48 percent, and the price of natural gas in the residential sector increased 15 cents or 2.03 percent. The industrial sector price decreased 34 cents or 8.77 percent, while the commercial sector price decreased 32 cents or 6.06 percent.

In 2020, the residential sector paid the highest price out of all the sectors at $7.34 per billion cubic feet. The commercial sector's price was the next highest at $4.99, the industrial sector's price was $3.54, and the electric power sector's price was $3.08 per billion cubic feet.

The prices are in nominal dollars to provide a better comparison.

Return to top of page

line chart showing Natural Gas Average Annual Prices by Sector in Nebraska.

Return to top of page

Nebraska Natural Gas
Average Annual Prices by Sector
2010 – 2020

(Nominal Dollars per Billion Cubic Feet)

Year Sectors Annual
Average
End–Use Sectors Electric
Power
Commercial Industrial Residential
2020 $4.99 $3.54 $7.34 $3.08 $4.59
2019 $5.31 $3.89 $7.20 $2.86 $4.88
2018 $5.76 $4.12 $7.85 $3.47 $5.32
2017 $5.84 $4.17 $8.27 $3.83 $5.35
2016 $5.01 $3.72 $7.37 $3.03 $4.69
2015 $5.90 $4.20 $8.16 $3.64 $5.40
2014 $6.80 $5.32 $8.20 $5.49 $6.35
2013 $6.10 $4.43 $7.89 $4.70 $5.63
2012 $5.92 $4.15 $8.30 $3.75 $5.30
2011 $6.45 $5.40 $8.51 $5.54 $6.38
2010 $6.86 $5.68 $8.68 $6.93 $6.69

Return to top of page

Nebraska Natural Gas
Average Annual Prices by Sector
1990 – 2009

(Nominal Dollars per Billion Cubic Feet)

Year Sectors Annual
Average
End–Use Sectors Electric
Power
Commercial Industrial Residential
2009 $7.16 $5.79 $8.98 $4.40 $6.86
2008 $9.26 $8.78 $10.70 $7.24 $9.32
2007 $8.76 $7.62 $10.66 $8.60 $8.74
2006 $9.25 $8.05 $10.87 $7.08 $9.07
2005 $9.11 $8.08 $10.30 $7.96 $9.06
2004 $7.33 $6.44 $8.74 $6.42 $7.48
2003 $6.67 $5.66 $7.57 $5.50 $6.62
2002 $4.93 $4.10 $5.97 $4.16 $5.00
2001 $7.15 $5.62 $8.34 $4.16 $6.99
2000 $5.29 $4.48 $6.23 $4.48 $5.27
1999 $4.04 $3.30 $4.93 $2.74 $4.01
1998 $4.13 $3.17 $4.98 $2.36 $3.93
1997 $4.76 $3.76 $5.55 $2.80 $4.66
1996 $4.32 $3.18 $4.71 $2.01 $4.11
1995 $3.94 $2.77 $4.81 $1.61 $3.79
1994 $4.19 $3.08 $4.96 $2.00 $4.08
1993 $4.26 $3.09 $4.96 $2.66 $4.14
1992 $3.97 $2.90 $4.79 $2.32 $4.00
1991 $3.83 $2.73 $4.59 $1.92 $3.83
1990 $3.82 $2.94 $4.55 $1.96 $3.83

Return to top of page

Nebraska Natural Gas
Average Annual Prices by Sector
1970 – 1989

(Nominal Dollars per Billion Cubic Feet)

Year Sectors Annual
Average
End–Use Sectors Electric
Power
Commercial Industrial Residential
1989 $3.72 $2.88 $4.42 $2.30 $3.73
1988 $3.71 $2.82 $4.42 $2.62 $3.71
1987 $3.66 $2.74 $4.31 $2.50 $3.62
1986 $3.85 $3.19 $4.49 $3.12 $3.97
1985 $4.18 $3.57 $4.97 $3.49 $4.31
1984 $4.24 $3.61 $5.05 $3.31 $4.34
1983 $4.18 $3.69 $4.91 $3.17 $4.30
1982 $3.47 $3.52 $4.13 $2.94 $3.73
1981 $2.94 $2.77 $3.43 $2.33 $3.03
1980 $2.27 $2.15 $2.71 $1.77 $2.34
1979 $1.96 $1.22 $2.25 $1.41 $1.78
1978 $1.50 $1.08 $1.92 $1.08 $1.46
1977 $1.36 $1.00 $1.75 $0.94 $1.32
1976 $1.13 $0.83 $1.33 $0.79 $1.05
1975 $0.97 $0.67 $1.25 $0.61 $0.87
1974 $0.78 $0.52 $1.10 $0.48 $0.70
1973 $0.73 $0.42 $1.00 $0.41 $0.61
1972 $0.56 $0.47 $0.95 $0.37 $0.60
1971 $0.57 $0.35 $0.89 $0.30 $0.54
1970 $0.51 $0.31 $0.82 $0.26 $0.49

Return to top of page

Sources: State Energy Price and Expenditure Report. Energy Information Administration, Washington, DC. Nebraska Department of Environment and Energy, Lincoln, NE.

Note: The price of natural gas delivered to electric utility consumers includes all steam electric utility generating plants with a combined capacity of 50 MW or greater.

The table and graph were updated on September 14, 2022.
Typically, there are one to two years between updates.

Return to top of page