Nebraska Department of Environment and Energy

Air Water Land Energy

Nebraska Energy Statistics

Nebraska's Natural Gas
Annual Consumption
by Sector

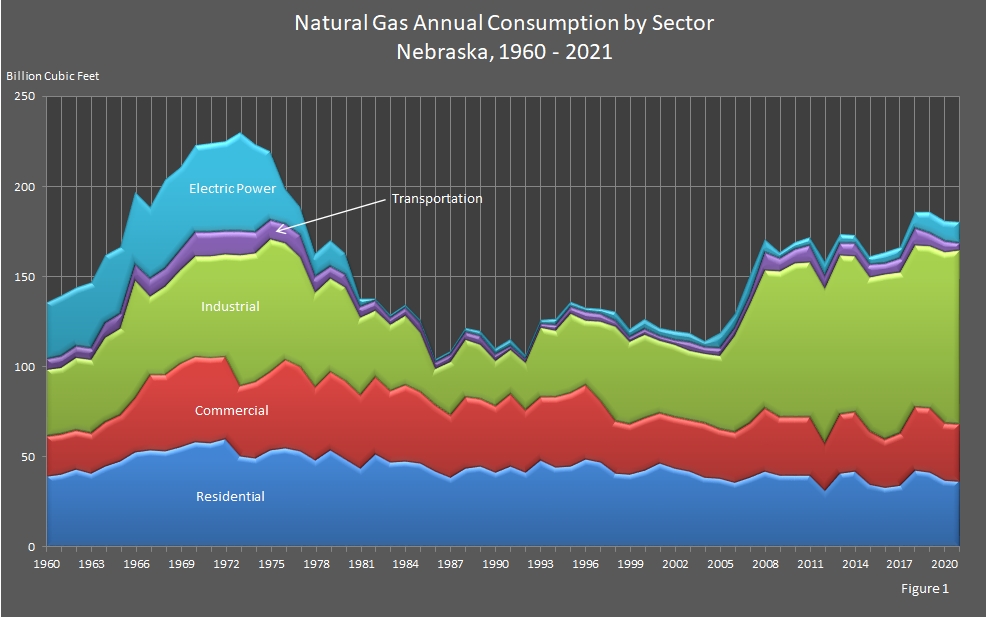
In 2021, Nebraska used 180.1 billion cubic feet of natural gas, a decrease of 0.35 percent from 2020. The industrial sector consumed 53.55 percent of the total consumption, the residential sector consumed 20.20 percent, and the commercial sector consumed 17.67 percent. The electric power and transportation sectors consumed 6.26 percent and 2.31 percent, respectively.

Within the residential sector, according to the "2021 American Community Survey", 59 percent of Nebraska households used natural gas as their primary heating fuel.

Return to top of page

line chart showing Natural Gas Annual Consumption in Nebraska by Sector.

Return to top of page

Nebraska Natural Gas
Annual Consumption by Sector
2020 – 2021

(Billion Cubic Feet)

Year Sectors Total
End–Use Sectors Electric
Power
Commercial Industrial Residential Transportation
2021 31.8 96.4 36.4 4.2 11.3 180.1
2020 31.6 94.9 37.0 6.3 10.8 180.7

Return to top of page

Nebraska Natural Gas
Annual Consumption by Sector
2000 – 2019

(Billion Cubic Feet)

Year Sectors Total
End–Use Sectors Electric
Power
Commercial Industrial Residential Transportation
2019 35.4 89.8 41.6 7.1 12.0 185.9
2018 35.4 89.6 42.4 9.4 9.2 186.0
2017 29.0 89.6 34.1 7.4 6.2 166.2
2016 27.0 91.1 33.1 6.4 5.8 163.4
2015 29.5 85.7 34.7 7.1 4.3 161.2
2014 32.4 86.9 42.1 7.2 4.2 172.8
2013 32.2 88.3 41.2 7.0 4.6 173.4
2012 26.5 85.6 31.3 7.6 7.7 158.8
2011 32.1 86.4 39.7 9.3 4.2 171.8
2010 32.0 85.5 40.1 7.4 3.9 168.9
2009 31.8 81.2 40.1 7.0 3.3 163.5
2008 34.8 76.7 42.4 10.0 7.2 171.0
2007 30.1 65.8 38.6 5.4 10.9 150.8
2006 28.1 53.6 35.9 4.5 7.8 129.9
2005 27.4 41.2 38.0 4.5 8.1 119.1
2004 29.9 39.2 38.6 4.0 3.3 115.0
2003 28.4 38.4 42.2 5.4 4.6 118.9
2002 28.2 40.7 43.8 2.7 4.9 120.3
2001 27.8 40.2 46.7 3.1 4.3 122.0
2000 28.9 46.8 42.5 3.2 5.5 127.0

Return to top of page

Nebraska Natural Gas
Annual Consumption by Sector
1980 – 1999

(Billion Cubic Feet)

Year Sectors Total
End–Use Sectors Electric
Power
Commercial Industrial Residential Transportation
1999 27.6 45.8 40.6 3.0 4.6 121.5
1998 28.9 53.1 40.8 2.9 5.1 130.7
1997 33.9 44.5 47.1 4.3 2.7 132.4
1996 40.8 36.2 49.0 4.6 2.3 132.9
1995 40.0 44.8 45.1 3.4 3.1 136.4
1994 38.9 37.0 44.4 3.3 3.1 126.8
1993 34.7 38.7 48.3 2.5 1.9 126.1
1992 34.5 26.5 41.4 2.6 1.9 106.9
1991 40.3 24.8 44.7 2.4 3.7 115.8
1990 36.5 25.8 41.5 3.5 3.8 111.1
1989 37.4 30.6 44.8 4.9 2.6 120.2
1988 39.4 32.3 43.5 4.7 2.0 122.0
1987 34.2 30.1 38.9 4.5 1.7 109.4
1986 36.4 20.4 42.3 3.9 1.7 104.7
1985 39.4 33.2 46.7 5.6 1.3 126.1
1984 41.9 38.6 47.8 4.6 1.5 134.5
1983 39.1 37.4 47.2 4.1 1.6 129.3
1982 43.0 37.1 51.4 5.2 1.6 138.2
1981 40.6 43.1 43.9 6.1 4.6 138.3
1980 43.4 51.9 48.9 7.0 11.9 163.1

Return to top of page

Nebraska Natural Gas
Annual Consumption by Sector
1960 – 1979

(Billion Cubic Feet)

Year Sectors Total
End–Use Sectors Electric
Power
Commercial Industrial Residential Transportation
1979 43.5 51.9 53.5 7.0 14.0 170.0
1978 40.7 52.3 48.2 8.9 12.8 163.1
1977 47.0 61.0 52.9 12.2 15.6 188.8
1976 48.7 64.9 55.0 10.4 19.6 198.6
1975 43.1 73.8 53.8 10.4 37.7 218.8
1974 42.3 71.5 49.4 11.5 48.0 222.8
1973 38.7 72.8 50.4 13.6 54.1 229.6
1972 45.5 56.8 60.0 13.1 49.2 224.6
1971 47.3 56.7 57.7 13.2 48.8 223.7
1970 46.8 56.4 58.3 13.1 47.6 222.3
1969 46.0 52.2 55.2 11.5 45.2 210.0
1968 41.8 49.6 53.4 10.0 48.6 203.3
1967 41.4 43.7 53.8 10.3 39.5 188.7
1966 29.9 65.0 52.9 9.3 39.5 196.7
1965 25.5 48.2 47.6 8.7 36.3 166.2
1964 24.2 47.0 45.1 8.2 37.7 162.2
1963 22.4 41.0 40.7 6.5 36.5 147.1
1962 21.7 40.5 43.2 6.6 32.3 144.3
1961 22.4 37.4 40.2 6.6 33.1 139.7
1960 21.9 37.0 39.5 6.3 31.0 135.7

Return to top of page

Sources: State Energy Data Report. Energy Information Administration, Washington, DC. Nebraska Department of Environment and Energy, Lincoln, NE.

Notes: Beginning with the reporting of 1996 annual data, EIA changed the customer category used for reporting deliveries to consumers in the agricultural industry from commercial to industrial. Totals may not equal the sum of the components due to independent rounding, and totals from one table to the next may not be equivalent.

The tables and graph were updated on January 9, 2024.
Typically, there are one to two years between updates.

Return to top of page