Nebraska Department of Environment and Energy

Air Water Land Energy

Nebraska Energy Statistics

Energy Prices in
Nebraska's Electric Power Sector

The electric power sector consists of facilities which generate electricity primarily for use by the public. Energy is used for the generation, distribution, and transmission of electric power.

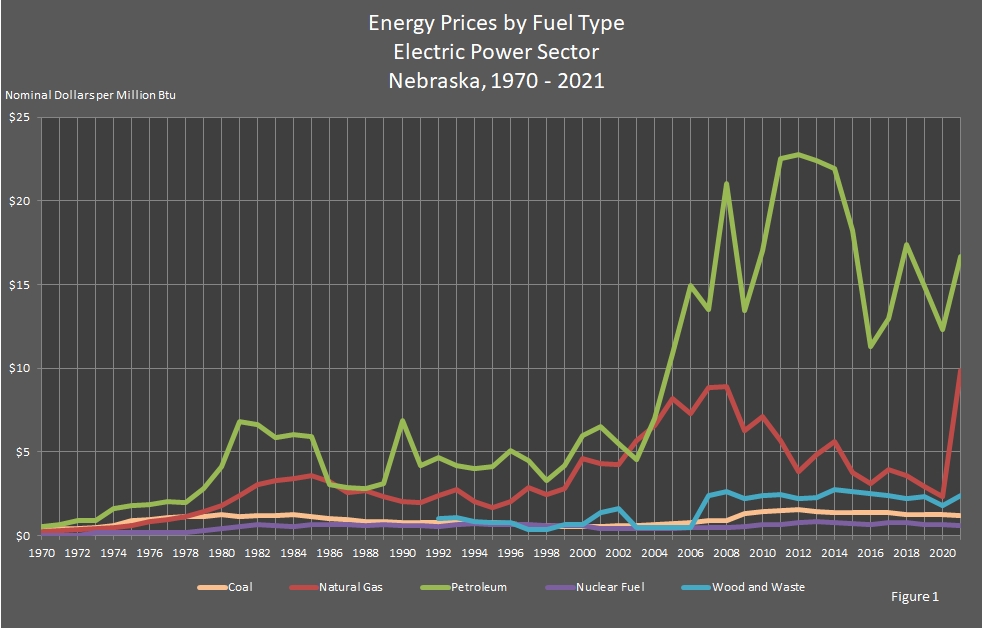
Using an equivalent measure of million British thermal units (Btu), the graph below compares the prices of fuel. The prices are also in nominal dollars to provide a better comparison.

In 2021, the highest price was for petroleum at $16.69 per million Btu. The natural gas price was $9.88 per million Btu, wood and waste was $2.39, coal was $1.18, and nuclear fuel was $0.61.

There were no direct fuel costs for hydroelectric, geothermal, wind, photovoltaic, or solar thermal energy, so no prices were reported.

Return to top of page

chart showing Energy Prices by Fuel Type in the Electric Power Sector in Nebraska.

Return to top of page

Nebraska Energy Prices
by Fuel Type, Electric Power Sector
2010 – 2021

[Nominal Dollars per Million British Thermal Units (Btu)]

Year Coal Natural
Gas
Nuclear
Fuel
Petroleum Renewable Annual
Average
Wood
and
Waste
2021 $1.18 $9.88 $0.61 $16.69 $2.39 $1.45
2020 $1.24 $2.36 $0.65 $12.32 $1.80 $1.16
2019 $1.23 $2.94 $0.69 $14.87 $2.33 $1.19
2018 $1.26 $3.56 $0.75 $17.36 $2.22 $1.25
2017 $1.37 $3.93 $0.76 $12.94 $2.22 $1.28
2016 $1.35 $3.11 $0.68 $11.28 $2.32 $1.19
2015 $1.34 $3.74 $0.72 $18.25 $2.66 $1.19
2014 $1.40 $5.64 $0.77 $21.92 $2.71 $1.30
2013 $1.42 $4.83 $0.84 $22.39 $2.26 $1.38
2012 $1.55 $3.85 $0.77 $22.78 $2.21 $1.47
2011 $1.51 $5.69 $0.69 $22.53 $2.45 $1.42
2010 $1.42 $7.12 $0.65 $17.02 $2.41 $1.25

Return to top of page

Nebraska Energy Prices
by Fuel Type, Electric Power Sector
1990 – 2009

[Nominal Dollars per Million British Thermal Units (Btu)]

Year Coal Natural
Gas
Nuclear
Fuel
Petroleum Renewable Annual
Average
Wood
and
Waste
2009 $1.33 $6.29 $0.56 $13.46 $2.20 $1.17
2008 $0.90 $8.88 $0.48 $21.03 $2.66 $0.98
2007 $0.88 $8.83 $0.46 $13.49 $2.42 $1.02
2006 $0.80 $7.27 $0.47 $14.92 $0.50 $0.87
2005 $0.71 $8.18 $0.43 $10.88 $0.48 $0.83
2004$0.66$6.60$0.44$ 6.99$0.48$0.65
2003$0.60$5.65$0.43$ 4.56$0.48$0.64
2002$0.58$4.27$0.44$ 5.51$1.64$0.59
2001$0.57$4.28$0.44$ 6.53$1.36$0.59
2000$0.56$4.60$0.61$ 5.99$0.67$0.67
1999$0.55$2.81$0.60$ 4.17$0.67$0.61
1998$0.59$2.43$0.61$ 3.31$0.37$0.63
1997$0.59$2.87$0.64$ 4.50$0.38$0.63
1996$0.72$2.06$0.64$ 5.11$0.78$0.71
1995$0.75$1.66$0.68$ 4.15$0.77$0.74
1994$0.76$2.05$0.73$ 3.98$0.86$0.77
1993$0.76$2.73$0.64$ 4.20$1.09$0.74
1992$0.75$2.38$0.57$ 4.65$0.99$0.69
1991$0.74$1.97$0.62$ 4.20$0.00$0.72
1990$0.75$2.01$0.61$ 6.89$0.00$0.73

Return to top of page

Nebraska Energy Prices
by Fuel Type, Electric Power Sector
1970 – 1989

[Nominal Dollars per Million British Thermal Units (Btu)]

Year Coal Natural
Gas
Nuclear
Fuel
Petroleum Renewable Annual
Average
Wood
and
Waste
1989$0.83$2.36$0.65$3.09$0.00$0.78
1988$0.84$2.69$0.63$2.83$0.00$0.79
1987$0.94$2.56$0.64$2.87$0.00$0.83
1986$1.04$3.21$0.64$3.05$0.00$0.89
1985$1.11$3.58$0.65$5.89$0.00$1.01
1984$1.28$3.40$0.57$6.04$0.00$1.06
1983$1.22$3.26$0.62$5.85$0.00$1.01
1982$1.17$3.02$0.68$6.65$0.00$0.96
1981$1.14$2.40$0.55$6.82$0.00$0.95
1980$1.24$1.82$0.44$4.14$0.00$1.00
1979$1.12$1.45$0.29$2.79$0.00$0.75
1978$1.11$1.11$0.20$1.95$0.00$0.65
1977$1.05$0.97$0.20$2.02$0.00$0.62
1976$0.93$0.81$0.20$1.86$0.00$0.62
1975$0.87$0.63$0.17$1.77$0.00$0.50
1974$0.60$0.49$0.16$1.60$0.00$0.43
1973$0.47$0.42$0.17$0.91$0.00$0.43
1972$0.43$0.38$0.00$0.88$0.00$0.41
1971$0.40$0.31$0.00$0.69$0.00$0.34
1970$0.35$0.27$0.00$0.54$0.00$0.30

Return to top of page

Sources: State Energy Price and Expenditure Report. Energy Information Administration, Washington, DC. Nebraska Department of Environment and Energy, Lincoln, NE.

Note: The average column contains the average price of all electric power sector energy sources for each year.

The table and graph were updated on January 9, 2024.
Typically, there are one to two years between updates.

Return to top of page