Nebraska Department of Environment and Energy

Air Water Land Energy

Nebraska Energy Statistics

Energy Consumption in
Nebraska's Electric Power Sector

The electric power sector consists of facilities which generate electricity primarily for use by the public.  Energy is used for the generation, distribution, and transmission of electric power.

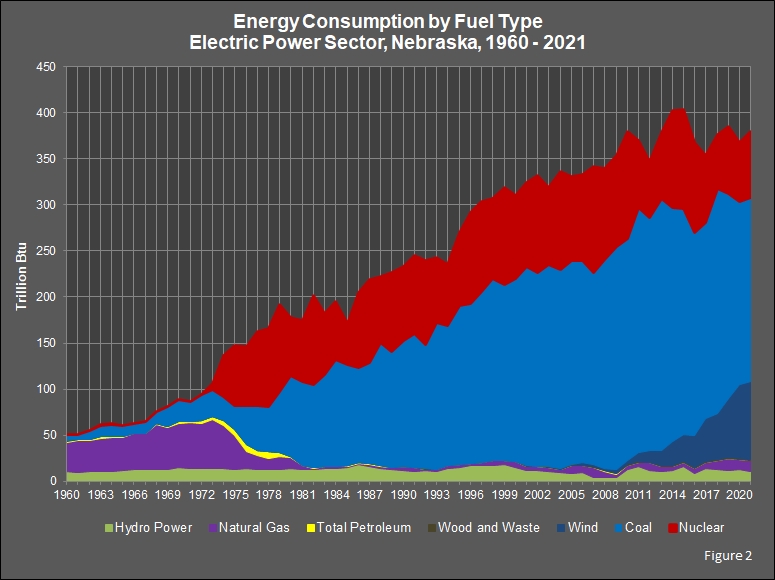
Between 2020 and 2021, electric power sector energy use increased 3.2 percent to 380.1 trillion British thermal units (Btu). Nuclear electric power use increased 11.2 percent, natural gas use increased 3.7 percent, renewable energy use increased 2.9 percent, and coal use increased 0.4 percent. Petroleum use increased nearly four–fold.

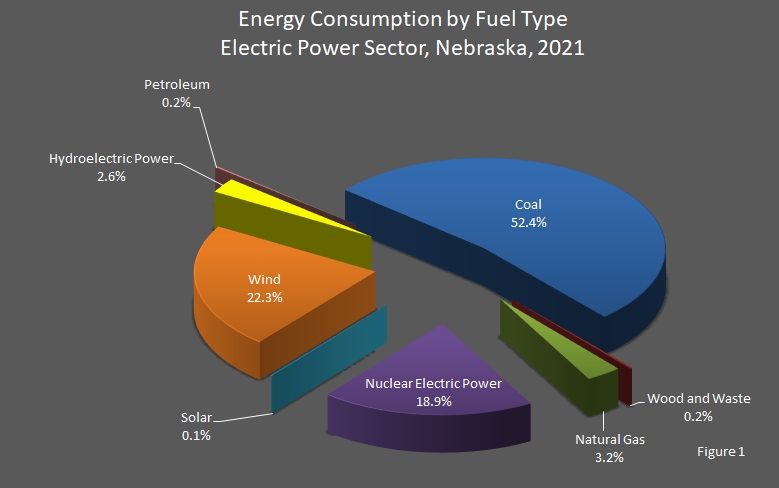
The principal fuels used at electric utilities are coal (52.43 percent), renewable energy (25.31 percent), and nuclear electric power (18.91 percent). Natural gas (3.16 percent), petroleum (0.21 percent), and solar thermal and photovoltaic energy (0.14 percent) made up the other 3.51 percent of fuels consumed. Petroleum was comprised totally of distillate fuel oil.

In 2021, if there was consumption of geothermal energy in the electric power sector, it was comparatively small and rounded to zero.

More information on solar energy, geothermal energy, and wind energy in Nebraska is available.

Hydroelectric power data was included in the renewable fuels total, but is shown separately in the graphs and data tables below.

pie chart showing Energy Consumption by Fuel Type in the Electric Power Sector in Nebraska.

Return to top of page

chart showing Energy Consumption by Fuel Type in the Electric Power Sector in Nebraska.

Return to top of page

Nebraska Energy Consumption
by Fuel Type, Electric Power Sector
2020 – 2021

[Trillion British Thermal Units (Btu)]

Year Coal Natural
Gas
Nuclear
Electric
Power
Petroleum Renewable Electricity
Net
Imports
Annual
Total
Distillate
Fuel
Petroleum
Coke
Residual
Fuel
Geothermal
Energy
Hydroelectric
Power
Solar
Thermal and
Photovoltaic
Energy
Wind Wood
and
Waste
2021 199.298 12.002 71.875 0.782 0.000 0.000 0.000 9.933 0.535 84.832 0.891 0.000 380.124
2020 198.587 11.575 64.646 0.217 0.000 0.000 0.000 12.187 0.470 79.914 0.871 0.000 368.463

Return to top of page

Nebraska Energy Consumption
by Fuel Type, Electric Power Sector
2000 – 2019

[Trillion British Thermal Units (Btu)]

Year Coal Natural
Gas
Nuclear
Electric
Power
Petroleum Renewable Electricity
Net
Imports
Annual
Total
Distillate
Fuel
Petroleum
Coke
Residual
Fuel
Geothermal
Energy
Hydroelectric
Power
Solar
Thermal and
Photovoltaic
Energy
Wind Wood
and
Waste
2019 222.890 12.930 72.590 0.240 0.000 0.000 0.000 11.940 0.280 64.215 0.780 0.000 385.860
2018 243.741 9.745 58.884 0.198 0.000 0.000 0.000 12.582 0.247 50.519 0.869 -0.121 376.628
2017 212.787 6.570 72.300 0.094 0.000 0.000 0.000 13.719 0.141 46.840 0.894 0.015 353.329
2016 220.452 6.171 97.798 0.091 0.000 0.000 0.000 7.906 0.037 35.067 0.865 0.000 368.384
2015 245.144 4.515 107.976 0.092 0.000 0.000 0.000 15.702 0.000 29.639 0.716 0.000 403.784
2014 254.573 4.330 105.655 0.569 0.000 0.000 0.000 11.010 0.000 26.028 0.642 -0.001 402.808
2013 272.659 4.723 71.736 0.540 0.000 0.000 0.000 10.723 0.000 17.191 0.619 0.000 378.191
2012 253.670 7.865 60.795 0.244 0.000 0.004 0.000 11.962 0.000 12.215 0.582 0.000 347.337
2011 266.339 4.261 72.549 0.398 0.000 0.008 0.000 15.713 0.000 10.210 0.649 0.000 370.126
2010 241.811 3.961 115.540 0.329 0.000 0.003 0.000 12.818 0.000 4.114 0.731 0.000 379.306
2009 242.326 3.326 98.682 0.253 0.000 0.006 0.000 4.233 0.000 3.735 0.645 0.000 353.205
2008 226.849 7.271 99.075 0.418 0.000 0.005 0.000 3.414 0.000 2.111 0.600 0.000 339.743
2007 208.672 11.079 115.815 0.310 0.000 0.143 0.000 3.434 0.000 2.143 0.615 0.031 342.241
2006 219.168 7.828 93.943 0.231 0.000 0.011 0.000 8.861 0.000 2.591 0.526 –0.004 333.155
2005 220.762 8.046 91.856 0.257 0.000 0.119 0.000 8.714 0.000 0.966 0.475 –0.014 331.181
2004 216.102 3.295 106.796 0.264 0.000 0.011 0.000 9.150 0.000 0.385 0.333 –0.009 336.321
2003 219.374 4.577 83.344 0.589 0.000 0.004 0.000 10.037 0.000 0.391 0.429 0.008 318.635
2002 209.834 4.830 105.696 0.247 0.000 0.003 0.000 11.165 0.000 0.082 0.093 0.000 331.951
2001 216.431 4.382 91.127 0.358 0.000 0.003 0.000 11.616 0.000 0.027 0.107 0.000 324.051
2000 198.588 5.589 89.988 0.584 0.000 0.118 0.000 15.309 0.000 0.000 0.106 0.000 310.282

Return to top of page

Nebraska Energy Consumption
by Fuel Type, Electric Power Sector
1980 – 1999

[Trillion British Thermal Units (Btu)]

Year Coal Natural
Gas
Nuclear
Electric
Power
Petroleum Renewable Electricity
Net
Imports
Annual
Total
Distillate
Fuel
Petroleum
Coke
Residual
Fuel
Geothermal
Energy
Hydroelectric
Power
Solar
Thermal and
Photovoltaic
Energy
Wind Wood
and
Waste
1999 190.768 4.626 105.452 0.379 0.000 0.028 0.000 17.579 0.000 0.000 0.107 –0.142 318.796
1998 197.464 5.119 86.643 0.481 0.000 0.066 0.000 17.160 0.000 0.000 0.098 –0.165 306.867
1997 185.618 2.710 97.267 0.416 0.000 0.000 0.000 17.080 0.000 0.000 0.160 0.002 303.254
1996 173.468 2.329 99.325 0.274 0.000 0.000 0.000 16.564 0.000 0.000 0.119 0.000 292.079
1995 172.736 3.081 78.650 0.357 0.000 0.000 0.000 14.706 0.000 0.000 0.168 0.000 269.697
1994 152.444 3.022 66.321 0.260 0.000 0.004 0.000 13.533 0.000 0.000 0.096 0.000 235.681
1993 159.266 1.851 71.481 0.247 0.000 0.000 0.000 10.326 0.000 0.000 0.059 0.000 243.230
1992 134.808 1.836 91.605 0.143 0.000 0.000 0.000 11.122 0.000 0.000 0.067 0.000 239.582
1991 145.630 3.454 84.372 0.158 0.000 0.021 0.000 10.902 0.000 0.000 0.000 0.000 244.537
1990 137.458 3.534 79.485 0.178 0.000 0.005 0.000 11.859 0.000 0.000 0.000 0.000 232.518
1989 125.654 2.463 85.480 0.284 0.000 0.385 0.000 12.083 0.000 0.000 0.000 0.000 226.350
1988 133.503 1.919 72.391 0.374 0.000 0.479 0.000 13.94 0.000 0.000 0.000 0.000 222.605
1987 110.571 1.667 89.684 0.194 0.000 0.372 0.000 16.329 0.000 0.000 0.000 0.000 218.816
1986 103.602 1.628 81.009 0.293 0.000 0.330 0.000 17.528 0.000 0.000 0.000 0.000 204.390
1985 110.361 1.201 43.911 0.358 0.000 0.000 0.000 15.051 0.000 0.000 0.000 0.000 170.882
1984 116.897 1.390 62.676 0.240 0.000 0.000 0.000 14.037 0.000 0.000 0.000 0.000 195.240
1983 99.392 1.477 66.321 0.463 0.000 0.002 0.000 14.157 0.000 0.000 0.000 0.000 181.812
1982 90.105 1.525 96.917 0.768 0.000 0.002 0.000 12.672 0.000 0.000 0.000 0.000 201.989
1981 91.280 4.236 66.048 0.464 0.000 0.085 0.000 12.510 0.000 0.000 0.000 0.000 174.622
1980 88.436 11.257 63.082 0.501 0.000 1.105 0.000 13.875 0.000 0.000 0.000 0.000 178.256

Return to top of page

Nebraska Energy Consumption
by Fuel Type, Electric Power Sector
1960 – 1979

[Trillion British Thermal Units (Btu)]

Year Coal Natural
Gas
Nuclear
Electric
Power
Petroleum Renewable Electricity
Net
Imports
Annual
Total
Distillate
Fuel
Petroleum
Coke
Residual
Fuel
Geothermal
Energy
Hydroelectric
Power
Solar
Thermal and
Photovoltaic
Energy
Wind Wood
and
Waste
1979 66.378 13.364 94.196 1.194 0.000 3.430 0.000 12.899 0.000 0.000 0.000 0.000 191.460
1978 48.698 12.433 84.522 1.970 0.000 5.839 0.000 12.303 0.000 0.000 0.000 0.000 165.765
1977 48.524 15.107 80.249 1.618 0.000 3.838 0.000 12.738 0.000 0.000 0.000 0.000 162.075
1976 41.906 19.049 64.335 1.630 0.000 6.284 0.000 13.240 0.000 0.000 0.000 0.000 146.445
1975 26.784 37.046 65.153 1.797 0.000 4.139 0.000 12.624 0.000 0.000 0.000 0.000 147.543
1974 26.103 47.224 44.596 1.465 0.000 3.122 0.000 13.509 0.000 0.000 0.000 0.000 136.019
1973 30.123 53.111 6.536 1.333 0.000 0.962 0.000 14.243 0.000 0.000 0.000 0.000 106.308
1972 28.283 48.367 0.000 1.631 0.000 1.100 0.000 14.239 0.000 0.000 0.000 0.000 93.620
1971 21.736 49.233 0.000 0.817 0.000 0.480 0.000 14.241 0.000 0.000 0.000 0.000 86.508
1970 24.050 48.022 0.000 0.734 0.000 1.181 0.000 14.381 0.000 0.000 0.000 0.000 88.368
1969 21.942 45.080 0.000 0.433 0.000 0.699 0.000 12.928 0.000 0.000 0.000 0.000 81.082
1968 13.035 48.471 0.000 0.306 0.000 0.494 0.000 13.039 0.000 0.000 0.000 0.000 75.345
1967 12.148 39.321 0.000 0.256 0.000 0.413 0.000 12.131 0.000 0.000 0.000 0.000 64.268
1966 10.215 39.345 0.000 0.295 0.000 0.476 0.000 12.104 0.000 0.000 0.000 0.000 62.435
1965 11.938 35.942 –0.064 0.415 0.000 0.670 0.000 11.659 0.000 0.000 0.000 0.000 60.561
1964 12.242 37.285 1.082 0.354 0.000 0.570 0.000 10.485 0.000 0.000 0.305 0.000 62.322
1963 11.315 36.148 0.886 0.602 0.000 0.971 0.000 10.621 0.000 0.000 0.426 0.000 60.969
1962 9.518 33.473 0.000 0.496 0.000 0.800 0.000 10.293 0.000 0.000 0.387 0.000 54.967
1961 5.183 34.257 0.000 0.370 0.000 0.596 0.000 9.880 0.000 0.000 0.519 0.000 50.807
1960 6.335 32.057 0.000 0.373 0.000 0.601 0.000 10.314 0.000 0.000 0.522 0.000 50.200

Return to top of page

Sources: State Energy Data Report. Energy Information Administration, Washington, DC. Nebraska Department of Environment and Energy, Lincoln, NE.

Note: Totals may not equal the sum of the components due to independent rounding.

The table and graphs were updated on January 9, 2024.
Typically, there are one to two years between updates.

Return to top of page