Nebraskans spent more than fourteen times as much on energy in 2021 as was spent in 1970. The amounts spent on energy in 2021 and in 1970 accounted for 7.9 percent and 11.5 percent, respectively, of consumer income. Looking at Figure 1, before the oil embargo of 1973–74, annual energy expenditures were roughly an 11–percent share of personal income. During the price shocks of the 1970s and early 1980s, energy's percent share of income rose to peak at 16.6 percent. Each year after peaking, the percentage steadily fell until it was under 10 percent. The percentage went as low as 7.7 percent in 1999. Then in 2000, the percentage started rising, and in 2005, energy's percent share of income was in double digits again. In 2009, the percentage dropped 20 percent from 2008 to 10.0 percent—a major factor was the decrease in energy prices. After that, the percentage was stable around 12 percent. In 2015, the percentage dropped to 8.5 percent due to a decrease in energy prices. From then on, the percentage was stable between 8.0 percent and 9.0 percent until 2020, when the percentage dropped to 6.8 percent. This was possibly due to COVID.
Nebraska Department of Environment and Energy
Air Water Land Energy
Nebraska Energy Statistics
Percent of Income
Spent on Energy
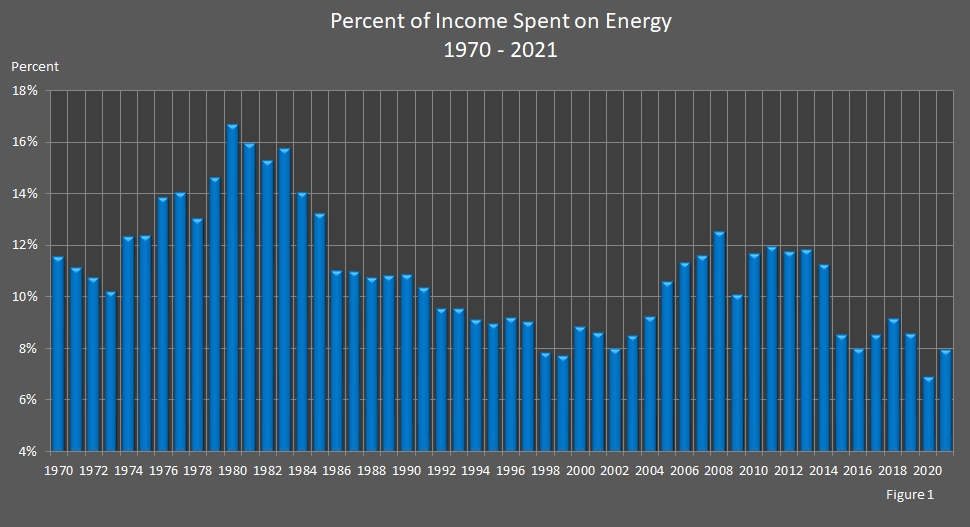
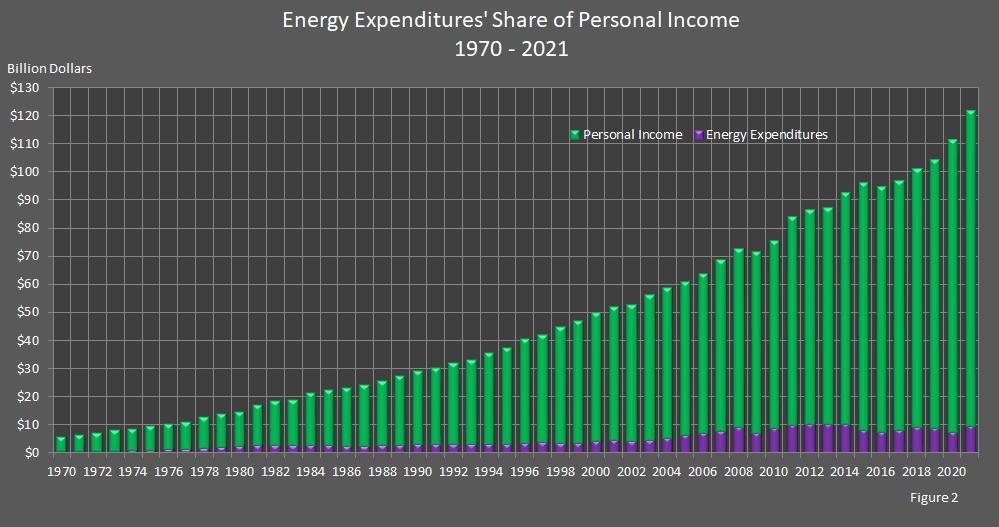
Figure 2 provides a bigger picture of the fifty–one–year period under review. Personal income steadily climbed from under $10 billion in 1970 to nearly $122 billion in 2021. Energy expenditures have been stable from $667.8 million in 1970 to $9.7 billion in 2021. In 2009, energy expenditures dropped 21 percent from 2008 to just over $7 billion and, in 2015, energy expenditures dropped another 21 percent from 2014 to just over $8 billion—a major player was decreases in energy prices.
| Year | Nebraska's
Total Energy Expenditures (Nominal Dollars) |
Nebraska's
Total Personal Income (Nominal Dollars) |
Nebraska's
Energy Expenditures as a Percent of Personal Income |
|---|---|---|---|
| Year | Nebraska's
Total Energy Expenditures (Nominal Dollars) |
Nebraska's
Total Personal Income (Nominal Dollars) |
Nebraska's
Energy Expenditures as a Percent of Personal Income |
| 2021 | $9,665,800,000 | $121,934,700,000 | 7.9% |
| 2020 | $7,637,000,000 | $111,545,000,000 | 6.8% |
| 2019 | $8,895,300,000 | $104,430,200,000 | 8.5% |
| 2018 | $9,210,700,000 | $101,204,200,000 | 9.1% |
| 2017 | $8,261,500,000 | $97,112,000,000 | 8.5% |
| 2016 | $7,557,400,000 | $94,838,000,000 | 8.0% |
| 2015 | $8,165,700,000 | $96,282,100,000 | 8.5% |
| 2014 | $10,356,700,000 | $92,524,000,000 | 11.2% |
| 2013 | $10,319,300,000 | $87,398,700,000 | 11.8% |
| 2012 | $10,170,800,000 | $86,754,200,000 | 11.7% |
| 2011 | $10,040,900,000 | $84,211,600,000 | 11.9% |
| 2010 | $8,788,100,000 | $75,489,600,000 | 11.6% |
| Year | Nebraska's
Total Energy Expenditures (Nominal Dollars) |
Nebraska's
Total Personal Income (Nominal Dollars) |
Nebraska's
Energy Expenditures as a Percent of Personal Income |
|---|---|---|---|
| Year | Nebraska's
Total Energy Expenditures (Nominal Dollars) |
Nebraska's
Total Personal Income (Nominal Dollars) |
Nebraska's
Energy Expenditures as a Percent of Personal Income |
| 2009 | $7,189,600,000 | $71,664,200,000 | 10.0% |
| 2008 | $9,103,000,000 | $72,815,500,000 | 12.5% |
| 2007 | $7,956,600,000 | $68,718,000,000 | 11.6% |
| 2006 | $7,216,700,000 | $63,850,600,000 | 11.3% |
| 2005 | $6,448,000,000 | $61,063,500,000 | 10.6% |
| 2004 | $5,404,900,000 | $58,826,400,000 | 9.2% |
| 2003 | $4,745,300,000 | $56,241,300,000 | 8.4% |
| 2002 | $4,197,600,000 | $52,884,600,000 | 7.9% |
| 2001 | $4,454,400,000 | $52,068,700,000 | 8.6% |
| 2000 | $4,382,100,000 | $49,767,700,000 | 8.8% |
| 1999 | $3,601,300,000 | $46,958,300,000 | 7.7% |
| 1998 | $3,496,700,000 | $44,804,800,000 | 7.8% |
| 1997 | $3,776,400,000 | $42,017,500,000 | 9.0% |
| 1996 | $3,735,800,000 | $40,790,100,000 | 9.2% |
| 1995 | $3,338,500,000 | $37,436,400,000 | 8.9% |
| 1994 | $3,249,700,000 | $35,731,200,000 | 9.1% |
| 1993 | $3,161,700,000 | $33,288,500,000 | 9.5% |
| 1992 | $3,063,600,000 | $32,208,400,000 | 9.5% |
| 1991 | $3,131,900,000 | $30,304,900,000 | 10.3% |
| 1990 | $3,163,900,000 | $29,240,300,000 | 10.8% |
| Year | Nebraska's
Total Energy Expenditures (Nominal Dollars) |
Nebraska's
Total Personal Income (Nominal Dollars) |
Nebraska's
Energy Expenditures as a Percent of Personal Income |
|---|---|---|---|
| Year | Nebraska's
Total Energy Expenditures (Nominal Dollars) |
Nebraska's
Total Personal Income (Nominal Dollars) |
Nebraska's
Energy Expenditures as a Percent of Personal Income |
| 1989 | $2,948,800,000 | $27,305,500,000 | 10.8% |
| 1988 | $2,755,600,000 | $25,727,200,000 | 10.7% |
| 1987 | $2,629,700,000 | $24,065,800,000 | 10.9% |
| 1986 | $2,528,000,000 | $22,999,500,000 | 11.0% |
| 1985 | $2,948,100,000 | $22,348,400,000 | 13.2% |
| 1984 | $2,970,500,000 | $21,214,700,000 | 14.0% |
| 1983 | $2,991,100,000 | $19,046,700,000 | 15.7% |
| 1982 | $2,811,700,000 | $18,420,700,000 | 15.3% |
| 1981 | $2,726,800,000 | $17,140,500,000 | 15.9% |
| 1980 | $2,456,300,000 | $14,758,200,000 | 16.6% |
| 1979 | $2,019,600,000 | $13,834,200,000 | 14.6% |
| 1978 | $1,669,500,000 | $12,840,900,000 | 13.0% |
| 1977 | $1,551,800,000 | $11,073,100,000 | 14.0% |
| 1976 | $1,410,400,000 | $10,217,400,000 | 13.8% |
| 1975 | $1,204,900,000 | $9,766,400,000 | 12.3% |
| 1974 | $1,054,800,000 | $8,565,100,000 | 12.3% |
| 1973 | $835,600,000 | $8,225,700,000 | 10.2% |
| 1972 | $754,600,000 | $7,052,500,000 | 10.7% |
| 1971 | $707,200,000 | $6,368,800,000 | 11.1% |
| 1970 | $667,800,000 | $5,798,400,000 | 11.5% |
Sources: State Energy Price and Expenditure Report. Energy Information Administration, Washington, DC. State Personal Income. Bureau of Economic Analysis, Washington, DC. Nebraska Department of Environment and Energy, Lincoln, NE.
The tables and graphs were updated on January 11, 2024.
Typically, there are one to two years between updates.