Nebraska Department of Environment and Energy

Air Water Land Energy

Nebraska Energy Statistics

Compressed Natural Gas Consumption as
Vehicle Fuel in Nebraska

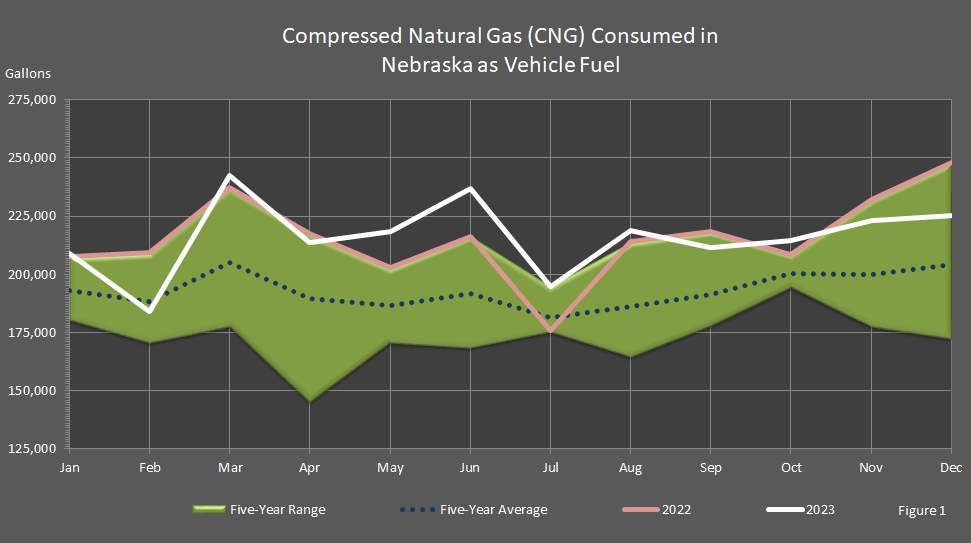
Compressed natural gas (CNG) consumption for vehicle use was volatile from January to August but leveled out the rest of 2023. Consumption jumped above and dropped into the five–year range three times from January to August. Consumption dropped to the upper boundary of the five–year range in September and then leveled out in October to December while being above and just inside the five–year range. This is seen in Figure 1.

As shown in the data table below, the amount of compressed natural gas (CNG) consumed as vehicle fuel had been relatively stable from month to month during 2006 to mid-2011 with a bit of volatility thrown in in the summer and fall months. During August and September of 2011, CNG experienced a spike in consumption and then consumption skyrocketed in November and December. This increase in consumption was due to the drop in natural gas prices. Significantly lower natural gas prices continued from 2012 to 2021. In February 2021, prices skyrocketed due to the polar vortex in Texas but returned to the five–year range. In the last half of 2021, natural gas prices soared with the onset of winter. At the end of the year, prices had fallen back into the five–year range. In 2022, natural gas prices skyrocketed from the second week in January to mid–December. Prices were very unstable. Consumption in 2022 was high regardless of natural gas prices. This could have been due to the increase in alternative fuel vehicles. See the "Henry Hub Natural Gas Spot Prices" report and "The Number of Registered Vehicles in Nebraska by the Fuel Consumed" report for information.

See Henry Hub data for spot price information.

Return to top of page

chart representing the gallons of compressed natural gas consumed as vehicle fuel in Nebraska

Return to top of page

Compressed Natural Gas Consumption as Vehicle Fuel in Nebraska
2006 – 2023

(Gallons)

Year Jan Feb Mar Apr May Jun Jul Aug Sep Oct Nov Dec Annual
Total
2023 209,083 184,090 242,439 213,490 218,311 236,898 194,804 218,679 211,401 214,421 223,285 225,375 2,592,276
2022 207,495 209,302 237,132 217,408 202,730 216,277 175,798 214,003 218,442 208,510 232,050 247,844 2,586,991
2021 181,246 198,341 213,749 215,599 192,839 203,917 195,010 182,587 202,434 202,870 209,376 224,801 2,422,769
2020 180,426 170,687 177,506 145,040 170,372 182,830 181,781 164,308 179,758 197,093 184,994 196,274 2,131,069
2019 206,995 189,569 196,243 192,485 185,081 168,184 178,492 176,601 178,358 200,184 177,431 172,087 2,221,710
2018 189,988 173,045 201,044 177,619 181,279 188,625 175,213 193,872 177,975 193,917 196,500 180,608 2,229,685
2017 118,079 116,767 139,561 124,073 118,350 119,933 109,607 112,626 115,715 103,453 148,341 192,565 1,519,070
2016 112,420 113,868 127,679 123,747 112,012 123,972 103,077 113,230 136,373 115,582 112,504 125,148 1,419,612
2015 68,497 65,484 84,792 77,214 120,103 131,559 124,553 122,788 132,554 124,067 106,520 122,217 1,280,348
2014 41,865 50,426 58,331 64,474 64,706 70,730 64,283 66,797 72,001 78,544 50,630 70,774 753,561
2013 27,904 26,195 37,961 29,585 32,515 48,128 29,872 34,387 51,470 37,577 40,559 55,846 451,999
2012 12,084 17,507 37,817 11,227 12,749 23,056 16,947 24,510 27,362 28,203 23,710 32,303 267,475
2011 4,413 3,349 3,684 2,418 3,756 5,678 5,204 9,165 9,383 6,178 12,077 20,306 85,611
2010 3,952 5,160 4,240 3,968 3,245 2,098 3,718 3,582 3,738 3,798 3,756 4,636 45,891
2009 3,600 4,000 3,760 3,520 4,072 3,862 4,591 3,744 4,359 5,432 4,616 5,350 50,906
2008 4,813 3,624 4,112 3,848 4,352 2,912 3,176 3,192 3,344 3,808 4,960 7,179 49,320
2007 4,376 4,144 3,550 3,792 3,728 4,288 4,595 3,888 2,090 1,696 4,432 5,001 45,580
2006 4,840 4,352 3,980 3,936 4,739 4,584 5,099 4,736 5,380 4,760 4,936 6,684 58,026

Return to top of page

Source: "Monthly Motor–Fuel Consumption." Nebraska Department of Revenue, Motor Fuels Division, Lincoln, NE.

Notes: The numbers are net volume numbers. NA indicates data is not available. Organizations, groups, companies, fuels, or individuals in the agency’s pages are for information only and are not an endorsement by the State of Nebraska or the Nebraska Department of Environment and Energy and its management or staff.

This report was updated on March 12, 2023.
Typically, there is six months between updates.

Return to top of page