Nebraska Department of Environment and Energy

Air Water Land Energy

Nebraska Energy Statistics

Energy Prices in
Nebraska's Transportation Sector

The transportation sector consists of private and public vehicles that move people and commodities. Included are automobiles, trucks, buses, motorcycles, railroads, aircraft, ships, barges, and natural gas pipelines. Natural gas use reflects the fuel needed to move natural gas through a pipeline to end users in the residential, commercial, industrial, and electric power sectors. Since 1990, natural gas consumption also includes natural gas consumed as vehicle fuel.

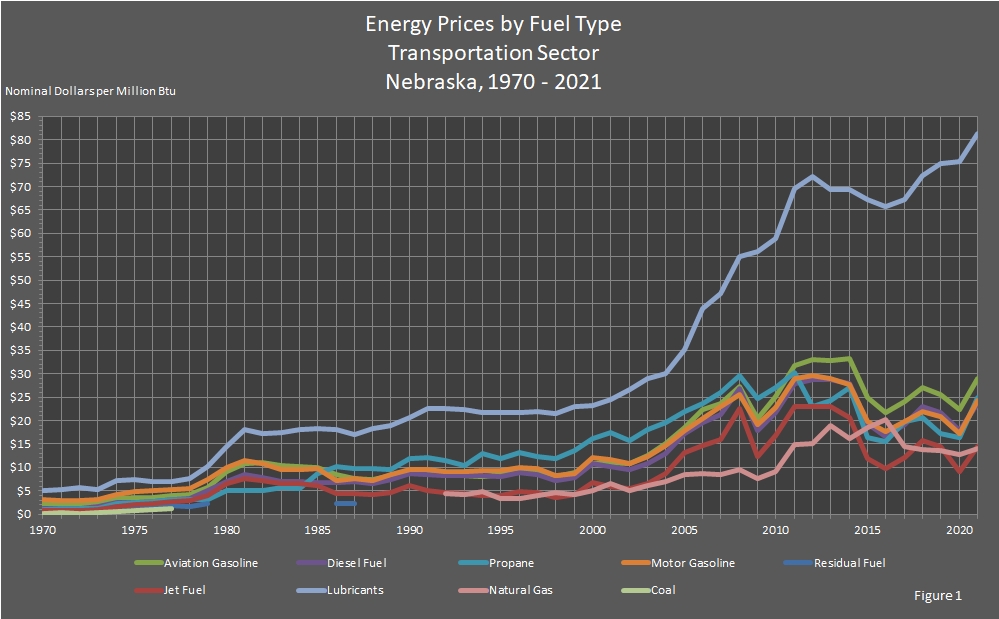
Using an equivalent measure of million British thermal units (Btu), the graph below compares the prices of fuel. The prices are also in nominal dollars to provide a better comparison. In 2021, lubricants had the highest price of $81.25 per million Btu. Aviation gasoline was $28.86, propane was $24.87, motor gasoline was $24.22, diesel fuel was $23.63, jet fuel was $14.48, and natural gas was $13.94. In 2021, if there was any coal, electricity, or residual fuel consumption in the transportation sector, the amounts were small enough to round to zero, and prices were not reported. The price for ethanol was not tracked, and there were no direct fuel costs for hydroelectric, geothermal, wind, photovoltaic, or solar thermal energy, so no prices were reported for these fuels.

Return to top of page

graphic showing Energy Prices by Fuel Type in the Transportation Sector in Nebraska.

Return to top of page

Nebraska Energy Prices
by Fuel Type, Transportation Sector
2010 – 2021

[Nominal Dollars per Million British Thermal Units (Btu)]

Year Coal Electricity Natural
Gas
Petroleum Annual
Average
Aviation
Gasoline
Diesel
Fuel
Jet
Fuel
Lubri­cants Motor
Gasoline
Propane Residual
Fuel
2021 $0.00 $0.00 $13.94 $28.86 $23.63 $14.48 $81.25 $24.22 $24.87 $0.00 $23.97
2020 $0.00 $0.00 $12.78 $22.34 $17.86 $9.10 $75.34 $17.15 $16.32 $0.00 $17.60
2019 $0.00 $0.00 $13.50 $25.57 $21.74 $14.37 $74.92 $20.90 $17.19 $0.00 $21.37
2018 $0.00 $0.00 $13.72 $27.04 $22.88 $15.64 $72.37 $21.93 $20.56 $0.00 $22.51
2017 $0.00 $0.00 $14.37 $24.13 $19.11 $12.10 $67.25 $19.78 $19.82 $0.00 $19.49
2016 $0.00 $0.00 $20.28 $21.62 $16.63 $9.72 $65.78 $17.62 $15.47 $0.00 $17.24
2015 $0.00 $0.00 $18.41 $24.86 $19.39 $11.88 $67.28 $19.80 $26.21 $0.00 $19.82
2014 $0.00 $0.00 $16.18 $33.16 $27.96 $20.59 $69.44 $27.59 $34.91 $0.00 $27.91
2013 $0.00 $0.00 $18.84 $32.71 $28.67 $22.89 $69.42 $28.85 $30.73 $0.00 $28.93
2012 $0.00 $0.00 $15.01 $33.04 $28.63 $22.97 $72.11 $29.59 $28.81 $0.00 $29.33
2011 $0.00 $0.00 $14.93 $31.64 $27.90 $23.03 $69.54 $28.96 $29.75 $0.00 $28.68
2010 $0.00 $0.00 $9.03 $25.19 $21.75 $16.78 $52.62 $22.74 $27.08 $0.00 $22.46

Return to top of page

Nebraska Energy Prices
by Fuel Type, Transportation Sector
1990 – 2009

[Nominal Dollars per Million British Thermal Units (Btu)]

Year Coal Electricity Natural
Gas
Petroleum Annual
Average
Aviation
Gasoline
Diesel
Fuel
Jet
Fuel
Lubri­cants Motor
Gasoline
Propane Residual
Fuel
2009 $0.00 $0.00 $7.50 $20.32 $17.82 $12.20 $56.07 $19.00 $24.68 $0.00 $18.73
2008 $0.00 $0.00 $9.47 $27.23 $26.91 $22.56 $55.12 $25.38 $29.65 $0.00 $26.15
2007 $0.00 $0.00 $8.50 $23.70 $21.17 $16.00 $47.16 $22.94 $25.98 $0.00 $22.33
2006 $0.00 $0.00 $8.58 $22.31 $19.55 $14.70 $43.88 $20.49 $23.73 $0.00 $20.19
2005 $0.00 $0.00 $8.47 $18.56 $17.23 $13.19 $35.22 $17.92 $21.95 $0.00 $17.71
2004 $0.00 $0.00 $7.04 $15.13 $12.90 $8.77 $30.11 $14.58 $19.64 $0.00 $13.97
2003 $0.00 $0.00 $6.17 $12.42 $10.74 $6.59 $28.94 $12.24 $17.99 $0.00 $11.69
2002 $0.00 $0.00 $4.97 $10.72 $9.48 $5.44 $26.70 $10.88 $15.80 $0.00 $10.36
2001 $0.00 $0.00 $6.51 $11.01 $10.16 $5.94 $24.51 $11.58 $17.41 $0.00 $11.08
2000 $0.00 $0.00 $4.97 $10.87 $10.76 $6.76 $23.20 $12.07 $16.24 $0.00 $11.54
1999 $0.00 $0.00 $4.14 $8.81 $7.82 $4.08 $23.04 $8.72 $13.68 $0.00 $8.31
1998 $0.00 $0.00 $4.51 $8.11 $7.22 $3.49 $21.44 $8.19 $11.77 $0.00 $7.79
1997 $0.00 $0.00 $4.07 $9.39 $8.49 $4.59 $21.82 $9.62 $12.41 $0.00 $9.15
1996 $0.00 $0.00 $3.32 $9.29 $8.92 $4.89 $21.63 $10.02 $13.08 $0.00 $9.55
1995 $0.00 $0.00 $3.27 $8.36 $8.00 $4.01 $21.75 $9.21 $11.89 $0.00 $8.77
1994 $0.00 $0.00 $4.74 $7.96 $8.21 $3.99 $21.71 $9.21 $12.93 $0.00 $8.81
1993 $0.00 $0.00 $4.20 $8.24 $8.29 $4.33 $22.37 $9.11 $10.45 $0.00 $8.81
1992 $0.00 $0.00 $4.41 $8.54 $8.20 $4.64 $22.49 $9.09 $11.38 $0.00 $8.78
1991 $0.00 $0.00 $0.00 $8.71 $8.44 $5.01 $22.58 $9.43 $12.06 $0.00 $9.10
1990 $0.00 $0.00 $0.00 $9.32 $8.66 $6.03 $20.61 $9.49 $11.79 $0.00 $9.22

Return to top of page

Nebraska Energy Prices
by Fuel Type, Transportation Sector
1970 – 1989

[Nominal Dollars per Million British Thermal Units (Btu)]

Year Coal Electricity Natural
Gas
Petroleum Annual
Average
Aviation
Gasoline
Diesel
Fuel
Jet
Fuel
Lubri­cants Motor
Gasoline
Propane Residual
Fuel
1989 $0.00 $0.00 $0.00 $8.28 $7.39 $4.54 $18.90 $8.42 $9.50 $0.00 $8.04
1988 $0.00 $0.00 $0.00 $7.41 $6.47 $4.14 $18.18 $7.22 $9.78 $0.00 $6.95
1987 $0.00 $0.00 $0.00 $7.55 $7.02 $4.38 $17.04 $7.58 $9.83 $2.29 $7.38
1986 $0.00 $0.00 $0.00 $8.41 $6.79 $4.43 $18.02 $7.28 $10.18 $2.32 $7.14
1985 $0.00 $0.00 $0.00 $9.99 $6.68 $6.19 $18.18 $9.67 $8.67 $0.00 $8.74
1984 $0.00 $0.00 $0.00 $10.27 $7.00 $6.50 $18.14 $9.55 $5.43 $0.00 $8.82
1983 $0.00 $0.00 $0.00 $10.44 $6.96 $6.63 $17.42 $9.61 $5.66 $0.00 $8.78
1982 $0.00 $0.00 $0.00 $10.92 $7.88 $7.19 $17.25 $10.71 $5.10 $0.00 $9.91
1981 $0.00 $0.00 $0.00 $10.84 $8.39 $7.60 $18.00 $11.37 $4.97 $4.63 $10.59
1980 $0.00 $0.00 $0.00 $9.02 $7.06 $6.47 $14.36 $10.06 $4.97 $0.00 $9.19
1979 $0.00 $0.00 $0.00 $5.73 $4.95 $4.03 $10.21 $7.41 $3.21 $2.27 $6.59
1978 $0.00 $0.00 $0.00 $4.29 $3.26 $2.90 $7.60 $5.50 $3.21 $1.69 $4.76
1977 $1.17 $0.00 $0.00 $3.97 $3.16 $2.69 $6.97 $5.29 $3.03 $1.80 $4.62
1976 $1.03 $0.00 $0.00 $3.59 $2.79 $2.26 $7.05 $5.06 $2.59 $1.75 $4.41
1975 $0.81 $0.00 $0.00 $3.45 $2.50 $2.09 $7.48 $4.76 $2.38 $1.74 $4.14
1974 $0.57 $0.00 $0.00 $3.23 $2.45 $1.60 $7.22 $4.27 $2.34 $1.66 $3.72
1973 $0.24 $0.00 $0.00 $2.36 $1.52 $0.93 $5.33 $3.21 $1.25 $0.65 $2.72
1972 $0.22 $0.00 $0.00 $2.19 $1.15 $0.78 $5.58 $3.00 $1.12 $0.72 $2.49
1971 $0.41 $0.00 $0.00 $2.21 $1.16 $0.78 $5.27 $3.00 $1.16 $0.59 $2.51
1970 $0.16 $0.00 $0.00 $2.17 $1.14 $0.75 $5.08 $3.03 $1.07 $0.50 $2.51

Return to top of page

Sources: State Energy Price and Expenditure Report. Energy Information Administration, Washington, DC. Nebraska Department of Environment and Energy, Lincoln, NE.

Note: The average column contains the average price of all transportation sector energy sources for each year.

The tables and graph were updated on January 9, 2024.
Typically, there are one to two years between updates.

Return to top of page