Nebraska Department of Environment and Energy

Air Water Land Energy

Nebraska Energy Statistics

Nebraska's Propane Consumption
as Vehicle Fuel

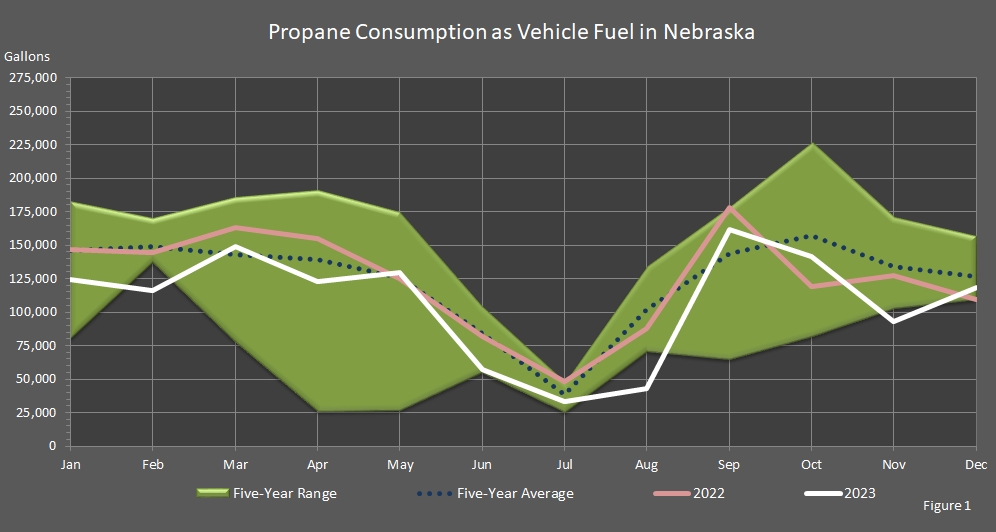
During the last half of 2023, propane consumption for vehicle use continued to be volatile. This can be observed in Figure 1.

According to the data table below, propane consumption as vehicle fuel had been a bit bumpy from month to month during past years and annual totals had been declining but consumption seemed to be rebounding in 2021 and 2022.

Return to top of page

chart representing the gallons of propane consumed as vehicle fuel in Nebraska

Return to top of page

Propane Consumption as Vehicle Fuel in Nebraska
2006 – 2023

(Gallons)

Year Jan Feb Mar Apr May Jun Jul Aug Sep Oct Nov Dec Annual Total
2023 124,680 115,838 148,711 122,996 129,920 57,211 32,994 42,747 161,460 141,811 92,626 118,320 1,289,314
2022 146,480 144,564 163,328 154,835 124,727 81,945 48,191 87,699 178,224 118,784 127,087 109,664 1,485,528
2021 79,178 136,449 138,572 141,298 134,923 104,192 48,067 87,351 159,919 168,608 106,125 116,695 1,421,377
2020 183,084 151,109 77,751 25,683 26,121 54,600 25,407 70,232 64,556 81,624 102,257 109,234 971,658
2019 160,125 142,731 150,200 191,425 174,835 85,828 46,058 131,576 167,056 190,802 164,171 156,990 1,761,797
2018 162,474 170,053 185,531 183,397 167,461 93,090 25,033 134,342 149,530 226,882 171,285 139,893 1,808,971
2017 153,055 188,756 208,386 194,129 202,605 131,824 34,107 46,674 171,365 191,999 159,120 170,832 1,852,852
2016 198,059 192,328 211,390 193,244 193,966 132,332 35,354 130,966 195,970 210,414 203,366 199,310 2,096,699
2015 198,748 165,393 218,990 207,028 144,800 105,447 75,270 179,030 196,280 241,890 180,491 190,199 2,103,566
2014 213,225 194,587 196,346 146,565 186,040 139,102 48,874 79,714 243,046 220,832 189,335 244,956 2,102,622
2013 49,423 48,341 68,238 48,995 48,768 64,739 32,098 149,880 257,843 225,106 209,218 220,190 1,422,839
2012 77,402 40,611 62,770 38,651 58,543 75,098 57,808 49,217 56,020 55,343 70,310 52,859 694,632
2011 39,016 68,521 90,943 31,157 65,541 60,479 65,126 60,048 54,787 60,993 68,562 44,749 709,922
2010 105,688 64,500 119,204 90,328 48,942 106,595 59,628 71,057 88,644 72,737 58,411 109,343 995,077
2009 37,665 45,906 134,918 66,228 52,356 120,767 52,986 109,999 89,696 79,235 100,115 120,345 1,010,216
2008 77,450 92,933 93,760 58,773 82,757 95,343 76,364 63,859 91,787 84,864 85,536 112,613 1,016,039
2007 81,521 78,319 121,051 70,477 77,719 98,154 65,485 113,195 97,222 86,389 76,081 115,248 1,080,861
2006 95,877 64,143 122,896 76,581 64,753 124,905 83,375 84,058 88,496 90,491 77,214 114,383 1,087,172

Return to top of page

Source: "Monthly Motor–Fuel Consumption." Nebraska Department of Revenue, Motor Fuels Division, Lincoln, NE.

Notes: The numbers are net volume numbers. NA indicates data is not available. Organizations, groups, companies, fuels, or individuals in the agency’s pages are for information only and are not an endorsement by the State of Nebraska or the Nebraska Department of Environment and Energy and its management or staff.

This report was updated on March 12, 2024.
Typically, there are six months between updates.

Return to top of page