Nebraska Department of Environment and Energy

Air Water Land Energy

Nebraska Energy Statistics

Nebraska's Petroleum Fuel and Oil Expenditures
in the
Agricultural Sector

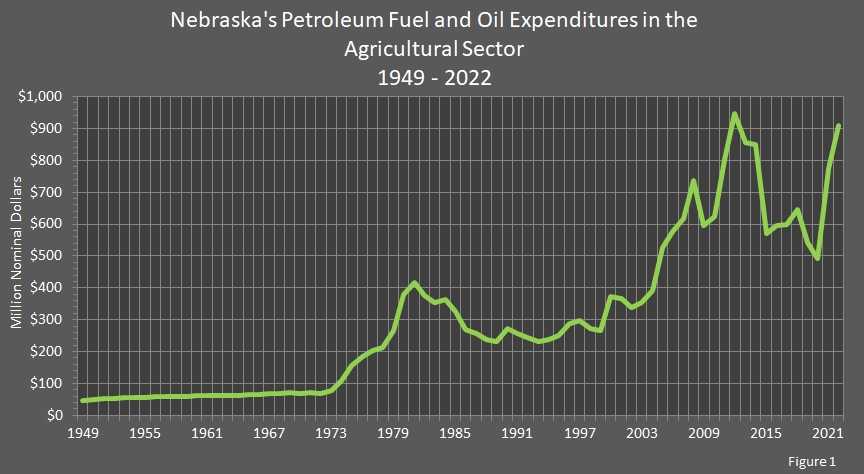
Expenditures on fuel and oil jumped to $910.0 million in 2022, which was a 17.5–percent increase from 2021 expenditures of $774.4 million.

A record high was set in 2012 at $948.0 million. The annual expenditures for fuel and oil in the agricultural sector in Nebraska are listed in the data table and graphed in Figure 1 below. The expenditures are in nominal dollars to provide a better comparison.

Return to top of page

line chart showing Nebraska's Fuel and Oil Expenditures in the Agricultural Sector.

Return to top of page

Nebraska's
Fuel and Oil Expenditures in the
Agricultural Sector
1949 – 2022

(Million Nominal Dollars)

Year . . . . . . Expense Year . . . . . . Expense Year . . . . . . Expense
2010 . . . . . . $623.1 2020 . . . . . . $491.6 2030 . . . . . . NA
2011 . . . . . . $801.9 2021 . . . . . . $774.4 2031 . . . . . . NA
2012 . . . . . . $948.0 2022 . . . . . . $910.0 2032 . . . . . . NA
2013 . . . . . . $856.7 2023 . . . . . . NA 2033 . . . . . . NA
2014 . . . . . . $851.0 2024 . . . . . . NA 2034 . . . . . . NA
2015 . . . . . . $569.7 2025 . . . . . . NA 2035 . . . . . . NA
2016 . . . . . . $596.9 2026 . . . . . . NA 2036 . . . . . . NA
2017 . . . . . . $599.0 2027 . . . . . . NA 2037 . . . . . . NA
2018 . . . . . . $646.9 2028 . . . . . . NA 2038 . . . . . . NA
2019 . . . . . . $541.8 2029 . . . . . . NA 2039 . . . . . . NA

Return to top of page

Year . . . . . . Expense Year . . . . . . Expense Year . . . . . . Expense
1980 . . . . . . $378.7 1990 . . . . . . $272.4 2000 . . . . . . $374.2
1981 . . . . . . $416.7 1991 . . . . . . $256.6 2001 . . . . . . $365.0
1982 . . . . . . $377.4 1992 . . . . . . $244.6 2002 . . . . . . $338.9
1983 . . . . . . $354.6 1993 . . . . . . $233.1 2003 . . . . . . $354.6
1984 . . . . . . $362.5 1994 . . . . . . $237.6 2004 . . . . . . $392.5
1985 . . . . . . $324.7 1995 . . . . . . $249.0 2005 . . . . . . $527.7
1986 . . . . . . $270.7 1996 . . . . . . $288.8 2006 . . . . . . $576.1
1987 . . . . . . $256.8 1997 . . . . . . $298.8 2007 . . . . . . $616.2
1988 . . . . . . $238.2 1998 . . . . . . $271.5 2008 . . . . . . $735.9
1989 . . . . . . $230.8 1999 . . . . . . $265.3 2009 . . . . . . $595.6

Return to top of page

Year . . . . . . Expense Year . . . . . . Expense Year . . . . . . Expense
1950 . . . . . . $49.6 1960 . . . . . . $61.4 1970 . . . . . . $69.4
1951 . . . . . . $51.7 1961 . . . . . . $61.9 1971 . . . . . . $70.2
1952 . . . . . . $52.9 1962 . . . . . . $62.1 1972 . . . . . . $68.7
1953 . . . . . . $54.6 1963 . . . . . . $62.4 1973 . . . . . . $78.5
1954 . . . . . . $55.4 1964 . . . . . . $62.6 1974 . . . . . . $108.5
1955 . . . . . . $57.0 1965 . . . . . . $64.1 1975 . . . . . . $155.8
1956 . . . . . . $58.6 1966 . . . . . . $65.2 1976 . . . . . . $185.7
1957 . . . . . . $60.5 1967 . . . . . . $67.1 1977 . . . . . . $203.5
1958 . . . . . . $59.7 1968 . . . . . . $68.0 1978 . . . . . . $213.6
1959 . . . . . . $60.3 1969 . . . . . . $70.9 1979 . . . . . . $264.9

Return to top of page

Year . . . . . . Expense
1949 . . . . . . $47.5

Return to top of page

Sources: United States Department of Agriculture. Nebraska Department of Environment and Energy, Lincoln, NE.

The table and graph were updated on January 29, 2024.
Typically, there is one year between updates.

Return to top of page