The total of both motor gasoline consumption and ethanol–blended fuel consumption in 2023 was 1.2 percent higher than in 2022 as shown in the data table below.
Total consumption of motor gasoline and ethanol–blended fuel in the month of May 2024 was 81,792,091 gallons, which was 14 percent higher than the previous month but two percent lower than May 2023.
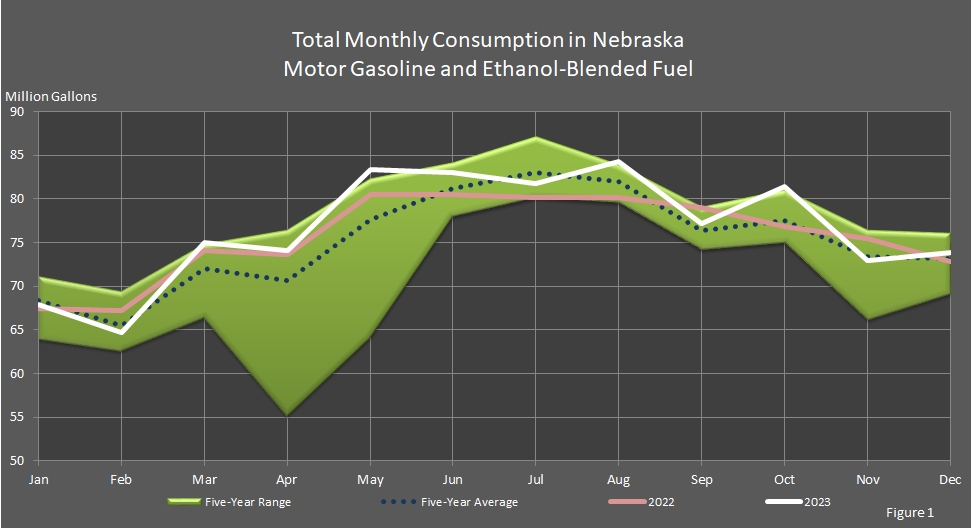
Figure 1 shows that May 2024's consumption was lower than May 2023's consumption but at the upper boundary of the five–year range and above the five–year average.
The driving season is traditionally the months between the Memorial Day and Labor Day weekends each year, so the months of June, July, and August usually have higher demand for these transportation fuels.
The reports on motor gasoline consumption and ethanol–blended fuel consumption have additional information in relation to the total of motor gasoline consumption and ethanol–blended fuel consumption.