Nebraska Department of Environment and Energy

Air Water Land Energy

Nebraska Energy Statistics

Nebraska's Total Energy Expenditures
by End–Use Sector

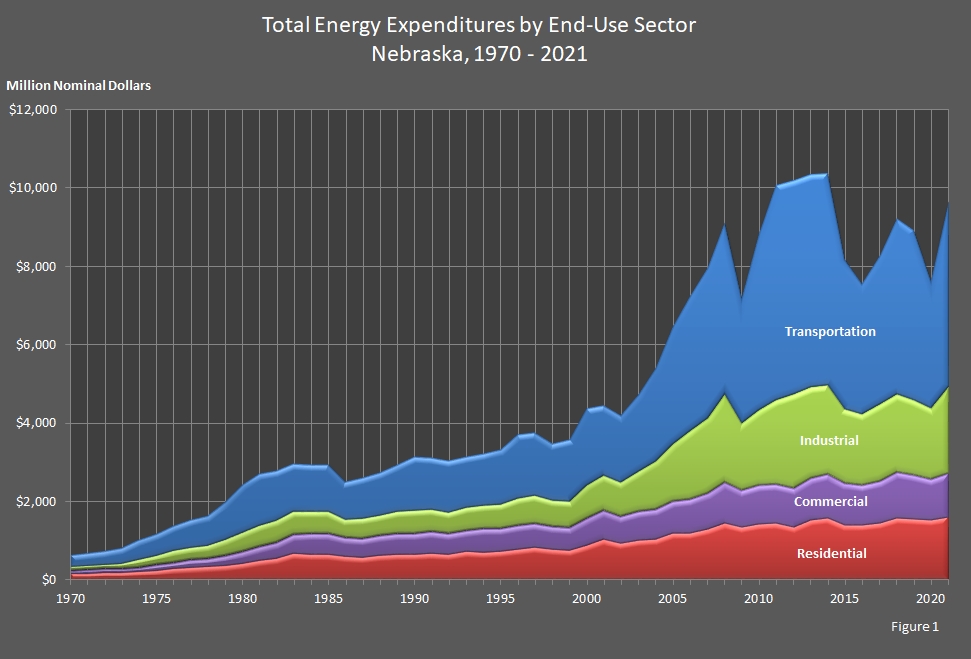
Nebraska's total expenditures on energy increased 26.6 percent to $9,665.9 million (or $9.7 billion) from 2020 to 2021.  In 2021, the transportation sector spent $4,709.1 million (or $4.7 billion), the industrial sector spent $2,219.6 million (or $2.2 billion), the residential sector spent $1,608.1 million (or $1.6 billion), and the commercial sector spent $1,129.1 million (or $1.1 billion).

Expenditures in the transportation sector were nearly half (48.7 percent) of Nebraska's total expenditures on energy in 2021.  Industrial sector expenditures comprised 23.0 percent, residential sector expenditures comprised 16.6 percent, and the commercial sector expenditures comprised 11.7 percent of Nebraska's total energy expenditures.

The expenditures are in nominal dollars to provide a better comparison.

Return to top of page

chart displaying Total Energy Expenditures by End Use Sector in Nebraska.

Return to top of page

Total Energy Expenditures by End–Use Sector
Nebraska
2010 – 2021

(Million Nominal Dollars)

Year End–Use Sectors Total
Energy
Expenditures
Commercial Industrial Residential Transportation
Year Commercial Industrial Residential Transportation Total
Energy
Expenditures
End–Use Sectors
2021 $1,129.1 $2,219.6 $1,608.1 $4,709.1 $9,665.9
2020 $1,055.1 $1,808.9 $1,522.6 $3,250.5 $7,637.1
2019 $1,133.1 $1,903.2 $1,556.3 $4,302.7 $8,895.3
2018 $1,158.7 $1,954.9 $1,586.9 $4,442.2 $9,142.7
2017 $1,075.3 $1,935.1 $1,442.0 $3,791.7 $8,244.1
2016 $1,027.6 $1,780.9 $1,391.7 $3,347.5 $7,547.7
2015 $1,072.4 $1,836.8 $1,447.2 $3,835.8 $8,192.2
2014 $1,136.9 $2,192.8 $1,613.3 $5,433.8 $10,376.8
2013 $1,090.7 $2,267.4 $1,577.5 $5,425.4 $10,361.0
2012 $990.5 $2,336.8 $1,390.4 $5,432.1 $10,149.8
2011 $997.1 $2,076.8 $1,473.5 $5,450.4 $9,997.8
2010 $997.0 $1,845.3 $1,427.7 $4,454.7 $8,724.7

Return to top of page

Total Energy Expenditures by End–Use Sector
Nebraska
1990 – 2009

(Million Nominal Dollars)

Year End–Use Sectors Total
Energy
Expenditures
Commercial Industrial Residential Transportation
Year Commercial Industrial Residential Transportation Total
Energy
Expenditures
End–Use Sectors
2009 $956.1 $1,675.7 $1,340.9 $3,181.9 $7,154.6
2008 $1,037.3 $2,263.5 $1,450.9 $4,351.3 $9,103.0
2007 $920.1 $1,905.1 $1,309.6 $3,821.8 $7,956.6
2006 $865.4 $1,715.4 $1,206.5 $3,429.4 $7,216.7
2006 $818.6 $1,464.0 $1,186.1 $2,979.2 $6,447.9
2004 $759.3 $1,224.8 $1,049.7 $2,371.1 $5,404.9
2003 $722.4 $1,043.7 $1,025.2 $1,954.0 $4,745.3
2002 $688.0 $853.4 $950.7 $1,705.5 $4,197.6
2001 $733.0 $907.3 $1,046.9 $1,767.1 $4,454.3
2000 $675.0 $852.2 $897.0 $1,957.9 $4,382.1
1999 $574.5 $661.2 $774.5 $1,591.1 $3,601.3
1998 $585.8 $676.7 $783.3 $1,450.9 $3,496.7
1997 $627.1 $700.0 $829.0 $1,620.4 $3,776.5
1996 $624.4 $666.5 $787.8 $1,657.0 $3,735.7
1995 $588.4 $603.7 $740.0 $1,406.4 $3,338.5
1994 $589.8 $604.3 $725.5 $1,330.0 $3,249.6
1993 $547.6 $573.5 $732.2 $1,308.3 $3,161.6
1992 $532.6 $544.4 $655.1 $1,331.5 $3,063.6
1991 $560.4 $553.5 $690.1 $1,327.9 $3,131.9
1990 $541.5 $595.7 $658.7 $1,368.0 $3,163.9

Return to top of page

Total Energy Expenditures by End–Use Sector
Nebraska
1970 – 1989

(Million Nominal Dollars)

Year End–Use Sectors Total
Energy
Expenditures
Commercial Industrial Residential Transportation
Year Commercial Industrial Residential Transportation Total
Energy
Expenditures
End–Use Sectors
1989 $531.1 $555.8 $666.6 $1,195.2 $2,948.7
1988 $515.2 $516.1 $635.3 $1,088.9 $2,755.5
1987 $479.0 $504.0 $586.9 $1,059.8 $2,629.7
1986 $485.9 $460.4 $598.7 $983.1 $2,528.1
1985 $533.7 $577.6 $651.6 $1,185.2 $2,948.1
1984 $542.6 $562.3 $657.7 $1,207.9 $2,970.5
1983 $484.6 $578.0 $696.8 $1,231.7 $2,991.1
1982 $404.8 $545.9 $568.0 $1,292.9 $2,811.6
1981 $365.4 $527.3 $501.5 $1,332.5 $2,726.7
1980 $296.2 $486.3 $440.7 $1,233.0 $2,456.2
1979 $253.0 $402.0 $382.2 $982.3 $2,019.5
1978 $208.6 $329.6 $350.2 $781.1 $1,669.5
1977 $201.0 $298.7 $330.5 $721.6 $1,551.8
1976 $177.2 $288.1 $292.7 $652.3 $1,410.3
1975 $140.5 $231.1 $254.9 $578.3 $1,204.8
1974 $122.9 $186.8 $219.0 $526.1 $1,054.8
1973 $108.6 $113.6 $205.4 $407.9 $835.5
1972 $101.5 $107.0 $191.9 $354.1 $754.5
1971 $98.9 $102.6 $180.8 $324.9 $707.2
1970 $88.4 $92.4 $170.0 $317.0 $667.8

Return to top of page

Sources: State Energy Price and Expenditure Report. Energy Information Administration, Washington, DC. Nebraska Department of Environment and Energy, Lincoln, NE.

Notes: Totals may not equal the sum of the components due to independent rounding.  There is a discontinuity in this time series between 1988 and 1989 due to the expanded coverage of non–electric utility use of wood and waste beginning in 1989.

The table and graph were updated on January 9, 2024.
Typically, there are one to two years between updates.

Return to top of page