official nebraska government website

Henry Hub Natural Gas Spot Prices 2005

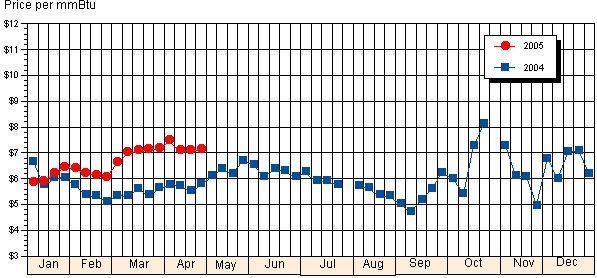
While temperatures were moderate, crude oil prices probably contributed to the continuing strength in natural gas prices.  Crude oil prices climbed throughout the week and then fell 5.5 percent yesterday (April 27).  For the week (Wednesday to Wednesday), the spot price at the Henry Hub increased only 1 cent per million British thermal units (mmBtu) to $7.11.  The price of $7.11 is $1.30, or 22 percent, above last year's level of $5.81.  Prices at most markets in the Lower 48 States remain about 20 percent higher than last year at this time.

The amount of natural gas in storage in the East Region increased 7.6% for the week ending April 22 to 636 billion cubic feet which was 115 billion cubic feet above the 5-year average.  Nebraska is a part of the East Region (see map) which is a major natural gas consumer, particularly in the residential and commercial sectors.  The industrial sector, which includes agriculture, is also a major consumer in this state.  Most of the gas is supplied from the Producing Region with a fair amount imported from Canada.  The Henry Hub in southern Louisiana is a major market center with interconnections for many of the pipelines that transport U.S.-produced gas to the East Region.  Furthermore, the Henry Hub is the preferred reference point for prices for most of the domestic gas destined for the East.  Therefore, market conditions and developments in the East Region and price movements and trends at the Henry Hub are usually highly correlated.

Notes:  An archive is available.  Divide the price by ten (10) to obtain the price per hundred cubic feet (ccf) or the approximate price per therm.

Natural Gas Spot Prices at the Henry Hub
2004 and 2005

Natural Gas Spot Prices at the Henry Hub 2005

[Price per Million British Thermal Units (mmBtu)]

Day Jan Feb Mar Apr May Jun Jul Aug Sep Oct Nov Dec
1 $6.29 $6.64 $7.58 NA NA NA NA NA NA
2 $6.38 $6.61 NA NA NA NA NA NA
3 $5.53 $6.30 $6.72 NA NA NA NA NA
4 $5.70 $6.12 $6.52 $7.80 NA NA NA NA NA
5 $5.84 $7.44 NA NA NA NA NA NA
6 $5.79 $7.46 NA NA NA NA NA NA
7 $5.85 $6.03 $6.67 $7.51 NA NA NA NA NA NA
8 $5.95 $6.84 $7.27 NA NA NA NA NA NA
9 $6.20 $6.99 NA NA NA NA NA NA
10 $6.23 $6.21 $6.90 NA NA NA NA NA
11 $5.96 $6.03 $6.73 $7.17 NA NA NA NA NA
12 $5.89 $7.34 NA NA NA NA NA NA
13 $6.05 $7.07 NA NA NA NA NA NA
14 $6.46 $5.95 $6.86 $7.02 NA NA NA NA NA NA
15 $6.01 $7.15 $6.95 NA NA NA NA NA NA
16 $6.11 $7.08 NA NA NA NA NA NA
17 Holiday $6.05 $7.24 NA NA NA NA NA
18 $6.68 $5.88 $7.12 $6.95 NA NA NA NA NA
19 $6.21 $7.01 NA NA NA NA NA NA
20 $6.26 $7.10 NA NA NA NA NA NA
21 $6.43 Holiday $7.17 $6.93 NA NA NA NA NA NA
22 $5.92 $7.25 $7.06 NA NA NA NA NA NA
23 $6.02 $7.11 NA NA NA NA NA NA
24 $6.41 $6.32 $7.08 NA NA NA NA NA
25 $6.46 $6.27 Closed $7.27 NA NA NA NA NA
26 $6.44 $7.08 NA NA NA NA NA NA
27 $6.50 $7.11 NA NA NA NA NA NA
28 $6.24 $6.64 $6.94 NA NA NA NA NA NA NA
29 $6.94 NA NA NA NA NA NA NA
30 $7.17 NA NA NA NA NA NA
31 $6.15 $7.47 NA NA NA

Sources: Natural Gas Weekly Update. Energy Information Administration, Washington, DC.  Nebraska Energy Office, Lincoln, NE.

Note: NA = Not available.

This table was updated on April 28, 2005.

Typically, there is one week between updates.