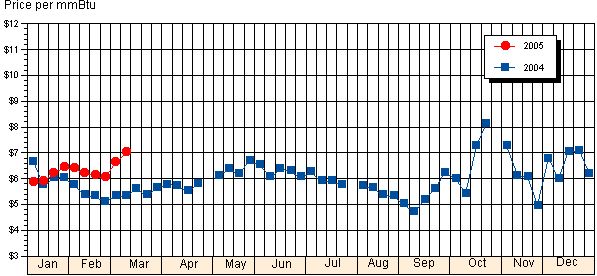
With the end of winter two weeks away, natural gas spot prices remain strong due to a late season cold front moving into major gas-consuming regions and boosting space-heating demand. For the week (Wednesday to Wednesday), spot prices at the Henry Hub increased 38 cents per million British thermal units (mmBtu), or 5.7 percent, to $6.99. This price is the highest recorded price at the Henry Hub this year.
Tennessee Gas Pipeline declared a force majeure on Tuesday for receipts on its Blue Water System offshore Louisiana after discovering a leak on the system. Although the leak could have affected up to 40,000 mmBtu per day, Tennessee Gas Pipeline had isolated the problem by Wednesday, and all but one meter is currently flowing gas. There appeared to be little impact on prices.
The amount of natural gas in storage in the East Region fell 12.1% for the week ending March 4 to 737 billion cubic feet which was 114 billion cubic feet above the 5-year average. Nebraska is a part of the East Region (see map) which is a major natural gas consumer, particularly in the residential and commercial sectors. The industrial sector, which includes agriculture, is also a major consumer in this state. Most of the gas is supplied from the Producing Region with a fair amount imported from Canada. The Henry Hub in southern Louisiana is a major market center with interconnections for many of the pipelines that transport U.S.-produced gas to the East Region. Furthermore, the Henry Hub is the preferred reference point for prices for most of the domestic gas destined for the East. Therefore, market conditions and developments in the East Region and price movements and trends at the Henry Hub are usually highly correlated.
Notes: An archive is available. Divide the price by ten (10) to obtain the price per hundred cubic feet (ccf) or the approximate price per therm.