Could Nebraskans benefit from an update of the state's building code? The Energy Office
commissioned a study, financed with a U.S. Department of Energy Special
Projects grant, to find the out the answer. The study examined
the cost effectiveness of increasing the state's residential energy
code...
It may seem hard to believe, but according to the U.S. Department
of Agriculture's 2003 farm income forecast, 94 percent of total farm
household income comes from off-farm sources. Many rural families
work off-farm jobs in addition to farming to make ends meet.
A famed energy consulting group has launched an internet tool
to demonstrate how renewable energy can be an integral part
of economic development. The Rocky Mountain Institute says its
'Community Energy Opportunity Finder' will determine a community's
"best bets....
In the most comprehensive guide yet for small wind turbine owners
and local officials to understanding and improving permitsand
regulations for small wind turbines is now available. Permitting
Small Wind Turbines: Learning from the California Experience
provides up-to-date information...
In the face of soaring – and record-breaking – energy prices in 2000,
Nebraskans did what they've done before – cut energy use wherever
they could. Despite the 3 percent decline in overall energy consumption,
the price Nebraskans paid soared 21 percent...
The Nebraska Public Power District has a long-term Energy Supply
Strategy to meet customers' future energy needs and a strategic
goal to add additional renewable energy sources to its power
generation portfolio. Before proceeding with its plans, the
utility's management wanted to see...
Last May, Nebraska joined the other states in the way natural gas
utilities are regulated. The state's Public Service Commission's
regulatory authority was extended to include investor-owned natural
gas systems. Historically, cities and villages regulated the rates
for investor-owned utilities...
In the number-numb, glassy-eyed world of energy statistics, sits a helpful
tool to help you answer the question: Is it really colder than last year? Is
this normal weather we're having?
Governor Mike Johanns announced the Ponca Tribe will receive a $45,373
grant from Nebraska Energy Office's oil overcharge trust funds for
a series of energy saving improvements at the Fred Leroy Health
Center in Omaha.
On behalf of the U.S. Department of Agriculture and the U.S. Department of
Energy, you are invited to a Renewable Energy and Energy Efficiency
Workshop in Kearney, NE on Friday, April 23, 2004 at the Buffalo County
Fairgrounds Exhibit Hall. The workshop
is scheduled from 9:00 a.m. until noon.
For more information, visit this link
containing the workshop's
details, times, locations, agenda, topics and speakers.
For people not familiar with the latest in clothes washing technology,
there's a new type on the market, which claims energy, and thus
energy dollar savings. The source of the savings is a faster
spin cycle...
Updated Building Code Could Produce Long-Lasting Benefits
How the New Code Could Save You Energy and Money
The complete study comparing the existing state codes with more recent
alternatives UNL MEC Study.
The proposed legislation upgrading the state’s building codes
FINAL LB 888.
What would happen if the proposed legislation becomes law? A one-page
summary MEC Q & A.
Could Nebraskans benefit from an update of the state’s building code? To find
out, the Energy Office commissioned a study, financed with a U.S. Department
of Energy Special Projects grant, to search for the answer.
The study examined the cost effectiveness of increasing the state’s residential
energy code in new home construction. Nebraska last updated its statewide
energy code in 1983.
This study compares the first year and life cycle cost impact of:
upgrading Nebraska’s current residential energy code, the 1983 Model
Energy Code, to the 2000 International Energy Conservation Code, and
upgrading the average residential energy code currently
required by local jurisdictions in the state to the 2000
International Energy Conservation Code.
Savings in the Thousands
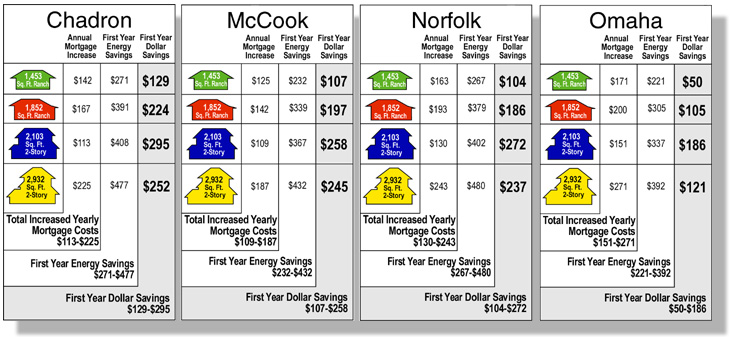
The findings were clear: An upgrade to the 2000 International Energy Conservation
Code from the 1983 Model Energy Code would generate dollar savings from
reduced energy use in excess of any mortgage payment increases due to higher
construction costs. The difference would mean a Nebraska homeowner could
pocket between $50 and $295 a year in savings, depending on where the homeowner
lived. Figure A illustrates the savings for four different house sizes in
four Nebraska cities.
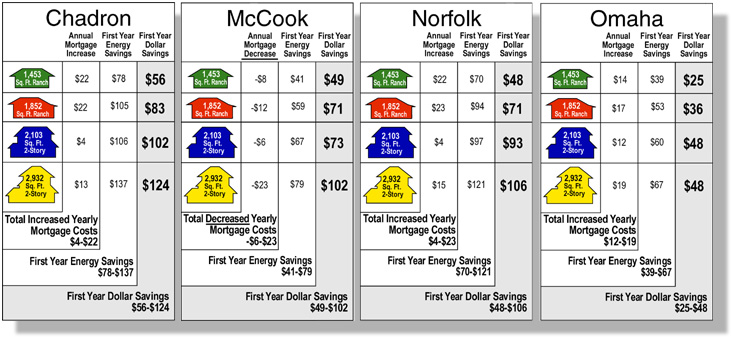
An upgrade to the 2000 International Energy Conservation Code from the current
average code used across the state produced first year net savings in every
case, as illustrated in Figure B. While the savings are not as dramatic,
they are still compelling: The difference would mean a Nebraska homeowner
could pocket between $25 and $124 a year in savings, depending on where
the homeowner lived.
Figure A. Four Cities, Four Houses:
Mortgage Costs and Energy Savings after Upgrade
to 2000 International Energy Conservation Code
Currently, only 13 of 69 jurisdictions accounting for less than 4 percent
of the dwellings constructed in the state have codes equivalent to the 2000
International Energy Conservation Code.
Based on statewide housing construction figures, an upgrade from the current
state average to the 2000 International Energy Conservation Code would produce
a combined first year cost savings of $254,000 for buyers of new homes this
year. And their savings will grow in subsequent years as energy costs rise.
Over the next thirty years, the houses built during a single year will provide
their collective owners with $5.5 million in net savings. These savings
would be available to the homeowners for additional expenditures, which
could bolster the state’s economy.
After implementation of the 2000 International Energy Conservation Code,
savings will continue to grow as more of Nebraska’s housing stock is built
to the new standard. Adoption of the 2000 International Energy Conservation
Code by the State of Nebraska will result in more than $59.6 million (in
2003 dollars) saved over the life of the houses built before 2015, even
if there is no housing growth during this period. Because these savings
come from reductions in energy use, adoption of the 2000 International Energy
Conservation Code would also help to shield Nebraska homeowners from future
fluctuations in energy prices.
Savings Are Compounded
Other benefits to the state included additional investments in construction
cost, which translates to approximately 1.13 million dollars in the first
year, benefiting local builders and suppliers while increasing the value
of the state’s residential infrastructure. While the new code would require
marginally higher construction costs, any increase in mortgage payments
is more than offset by the annual energy savings. The actual first year
energy savings are $340,000, and will continue to compound each year as
more houses are constructed to the upgraded standard. With more than 80
percent of the money Nebraskans spend on energy leaving the state, this
savings produces a strong and immediate benefit for the state’s economy.
Thus, the code upgrade benefits builders, suppliers, homeowners and the
state.
About the Study
The study considered the reduction in energy costs associated with energy
code upgrades and compared those savings to any increases in costs of construction
required to meet the code. Weather conditions, construction costs and utility
rates were considered for four cities selected to represent climate zones
in the state: Chadron, McCook, Norfolk, and Omaha.
Figure B. Annual Mortgage Increase/Decrease and
First Year Energy Savings —
Upgrade to 2000 International Energy Conservation Code.
Four houses were modeled for the study: a small ranch style house with 1,453
square feet; a medium ranch style house with 1,852 square feet; a medium
two story house with 2,103 square feet; and a large two story house at 2,932
square feet. Occupancy and usage patterns were based on national data for
average use.
Details, including how the building components were constructed to meet
the various codes, how the state average requirements were determined, development
of the usage patterns, economic data used in the cost calculations, the
basis for choosing the four cities mentioned above, and the documented sources
were included in the full report.
It may seem hard to believe, but according to the
U.S. Department of Agriculture’s 2003 farm income forecast, 94
percent of total farm household income comes from off-farm sources.
Many rural families work off-farm jobs in addition to farming to
make ends meet.
Dan McGuire, chief executive officer of the American Corn Growers
Foundation, said that low commodity prices combined with high
production costs are responsible for this. McGuire said that the
farm income forecast is a compelling reason for farmers and ranchers
to support wind energy because it provides a source of income and
fosters economic development in rural communities. “Wind farming
does pay,” he said.
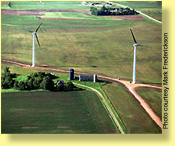
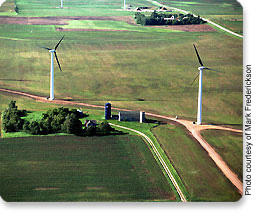
Renewable Energy Wind Farm in Minnesota
Minnesota Pioneers
McGuire cites a Minnesota project that demonstrates why farmers, ranchers
and rural communities should get involved with wind energy as a new source
of income. The Kas Brothers’ wind farm at Pipestone, completed in 2001,
is the first farmer-owned commercial wind farm in the United States. Developer
Dan Juhl installed two NEG Micon 750-kilowatt turbines with an estimated
annual electricity production of 4.5 million kilowatt-hours. That wind farm
now yields $30,000-$40,000 annually for the first 10 years of operation
and is expected to yield $110,000-$130,000 annually thereafter, depending
on the level of electricity production.
McGuire said this project is an excellent example of community-based economic
development. Local contractors Olsen Electric and K-Wind participated. Xcel
Energy contracted to purchase the electricity. Local banks provided the
financing. The wind turbine, the power contract, the maintenance agreement
and insurance allow the banks to make the loans with little risk. Local
ownership also keeps the electricity revenue circulating in the community.
This wind farm model is so successful that Juhl has several new projects
in the works.
Texas Too
Although Minnesota has emerged as a leader in implementing wind energy in
rural communities, Texas is also setting an example for states to follow.
After the Texas legislature passed a renewable energy requirement, utilities
and wind companies invested $1 billion in 2001 to build 912 megawatts of
new wind power projects. The results?
According to a report published by
the SEED Coalition and Public Citizen’s Texas office, “The completed
plants created 2,500 quality jobs with a payroll of $75 million, will deliver
$13.3 million in tax revenue for schools and counties and pay landowners
$2.5 million in royalty income in 2002 alone.
Wind generators under construction at
Combine Hills Turbine Ranch, Oregon
The multiplier effect of this
new investment activity will stimulate another 2,900 indirect jobs in Texas.
Wind power is bringing relief to rural Texas and creating jobs statewide.”
Wind power also is providing “a nice kick” to the local economy
of Milton-Freewater, Oregon, according to Mayor Lewis Keys. The new 41 megawatt
Combine Hills Turbine Ranch wind farm in his district will provide wind
power for area residents, who also will benefit from the infusion of construction
dollars. “Having been a farmer of wheat, barley and peas for 35 years,
it was hard to imagine the surrounding land being used for anything other
than farming, but now I can see the diversity of its uses,” Keys said.
Leroy Ratzlaff, a third-generation landowner and farmer in Hyde County,
South Dakota, agrees. Ratzlaff and his family used a homemade wind generator
in the 1930s before rural electrification reached their farm. In 2003, he
leased his land to a wind developer that installed seven wind turbines,
providing a much-needed economic boost. “It’s not as risky as farming,”
Ratzlaff said.
U.S. Corn Growers Support Wind Energy
In April of 2003, the American Corn Growers Foundation commissioned
a nationwide, random and scientific survey of more than 500 corn
farmers in the 14 states representing nearly 90 percent of the
nation's corn production. The poll found that 93.3 percent of
the nation's corn producers support wind energy; 88.8 percent
want farmers, industry and public institutions to promote wind
power as an alternative energy source; and 87.5 percent want utility
companies to accept electricity from wind turbines in their power
mix.
Because much of the nation’s wind energy potential
is found in rural areas, wind energy offers an unprecedented opportunity
for rural economic development. Wind energy can offer:
Benefits to Rural Landowners
Rural landowners who lease their land to wind developers typically receive
about 2-4 percent of the gross annual turbine revenue — $2,000
to $4,000 for each turbine — which can help compensate for a downturn
in commodity prices. The Union of Concerned Scientists estimates that
typical farmers or ranchers with good wind resources could increase
the economic yield of their land by 30-100 percent. Wind turbines have
a small footprint and do not occupy much land, so farming and ranching
operations can continue. “It’s almost like renting out my farm
and still having it,” Ratzlaff said. “And the cows don’t seem
to mind a bit.”
U.S. Corn Growers Support Wind Energy continued...
Increased Local Tax Base
Wind power projects bring new tax revenue to rural communities. Payments
generally range from 1-3 percent of the project’s value. At 1 percent,
property tax payments would provide approximately $10,000 for each megawatt
for rural communities each year. These revenues can be used to build
new schools, roads, bridges, and other infrastructure.
Here are some examples of states that are increasing their tax revenue
because of wind energy projects:
Pecos County, Texas, added $4.6 million to its property tax
revenue in 2002 alone.
In Iowa, 250 megawatts of wind development provide $2 million per
year in property tax revenues for local communities.
A 20 megawatt wind farm in Kewaunee County, Wisconsin, will result
in annual property tax payments of $200,000 to the county, or 50
percent of its annual budget.
The development in Hyde County, South Dakota, will result in
$250,000 for the county.
New Jobs
Wind power projects create new jobs in rural communities in manufacturing,
transportation and construction of projects. Roads must be built. Towers
must be erected. Once the projects are complete, jobs are created in
the operation and maintenance of the projects. The wind power plant
in Lake Benton, Minnesota, is now the second largest employer in town,
after the school district. In Iowa, construction provided 200 six-month
construction jobs and 40 permanent maintenance and operations jobs at
an average wage of $16 per hour. The U.S. wind industry currently contributes
to the economies of 46 states. And according to a study by the New York
State Energy Research and Development Authority, wind energy produces
27 percent more jobs per kilowatt-hour than coal plants and 66 percent
more jobs than natural gas plants.
Benefits to the Communities
Not only do rural communities benefit directly from wind power projects,
but they also benefit indirectly. When new jobs and additional farming
income are created, the paychecks are spent in local stores and restaurants,
boosting the local economy and creating additional jobs. Of course,
wind energy offers many benefits beyond rural economic development.
Wind energy is “homegrown” energy that can extend non-renewable energy
sources, helping to secure our energy future, reduce energy costs and
reduce our dependence on foreign energy. Wind power produces no air
or water emissions, which improves the health of our environment. But
perhaps the greatest benefit of all is the hope that wind energy projects
can offer to rural Americans who wish to remain on their family farms
and make a living from them. “We never dreamed this would happen,”
Ratzlaff said about the turbines on his land. “It’s going to make
for a merry Christmas!”
This article was prepared with information provided by the U.S.
Department of Energy, Wind Powering America program.
Learn More about Wind and Economic Development in Your
Rural Community
Windustry
This organization partners with the Institute for Agriculture and
Trade Policy to promote wind education and outreach. The organization’s
Web site at Windustry
features a section called Wind Farmers Network of America.
If you don’t have Internet access, write to Windustry, 2105 First
Avenue South, Minneapolis, MN 55404; or call 800-946-3640.
Wind Powering America logo
Wind Powering America Program
The Wind Powering America Program is committed to dramatically increasing
the use of wind energy in the United States. Visit the Wind Powering
America Web site at:
Wind
Powering America
to find state wind maps, small wind consumer's guides, wind workshops
that are going on in your area, and much more.
American Wind Energy Association
AWEA offers a fact sheet entitled “Wind Energy for Your Farm or
Rural Land.” It is available online at
Windy
Landowners.
You can also access a list of developers at
AWEA Developers List.
Write to The American Wind Energy Association at 122 C Street
NW, Suite 380, Washington, DC 20001; or call 202-383-2500.
American Corn
Growers Foundation
American Corn Growers Foundation
Learn more about the foundation’s "Wealth from the Wind" program
at American Corn Growers Foundation.
Write to the foundation at P.O. Box 18157,
Washington, DC 20036; or call 202-835-0330.
Wind Energy Resource Atlas
To find out whether you have a strong wind resource in your area,
visit Wind Energy Resource Atlas.
Information supplied by the U.S. Department of Energy’s Wind
Powering America aided in the preparation of this article.
Online Tool to Help Municipalities Adopt Renewable Energies
Rocky Mountain Institute
The Rocky Mountain Institute developed the Community Energy
Opportunity Finder in order to help your community realize the
benefits of wise energy use.
A famed energy consulting group has launched an internet tool to
demonstrate how renewable energy can be an integral part of economic
development.
The Rocky Mountain Institute says its
‘Community Energy Opportunity
Finder’ will determine a community's “best bets for energy
solutions that benefit the local economy, the community and the
environment.”
The Energy Finder — A Great Tool for Communities
Community Energy Finder Tool
The Community Energy Opportunity Finder is an interactive tool that
will help you determine your community's best bets for energy solutions
that benefit the local economy, the community, and the environment.
The Finder helps you collect information on your community's energy
use, and then demonstrates the potential energy savings, dollar
savings and job creation from energy efficiency programs.
The ‘Community Energy Opportunity Finder’ compiles
information on energy use in any community, and then demonstrates
the potential energy savings, cost savings, reductions in greenhouse
gas emissions and job creation from energy efficiency programs and
provides an overview of the green power sources that are available.
It also contains case studies on programs that have been successful
in other U.S. communities, sources of advice and ideas for funding
energy projects.
Municipalities create jobs and a tax base by attracting industry,
and often offer tax breaks to new companies. The new entities then
compete with existing firms for resources and increase infrastructure
costs, which often puts the community into a worse state than before
it attracted the new investments. The Finder is designed to be used
by economic development advocates, business owners who want to
reduce operating costs, communities that want to ensure their
economic development is compatible with sustainable development
principles and renewable energy advocates.
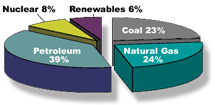
U.S. Energy Consumption
by Source, 2001
Source:
Energy Information Administration
“Renewable energy is an important piece of a comprehensive and
self-reliant community energy plan,” says the site. “When it becomes
necessary to increase the energy supply or if a community wants to
replace polluting energy sources with clean, renewable ones,
community leaders can consider developing the local solar, wind,
biomass, geothermal, and hydropower resource potential.”
The Community Energy Opportunity Finder was developed by
Rocky Mountain Institute staff
with support from the U.S. Environmental Protection Agency and
support from the U.S. Department of Energy, National Renewable
Energy Laboratory, Renewable Energy Policy Project, American
Wind Energy Association, and more than 50 others.
This Handbook is a great source of information
on small wind generators. For example, did you know that
surrounding property values are not effected negatively?
In fact they have been shown to increase in value.
Did you know small wind turbines do not interrupt telecommunications
or radio wave transmissions? They enhance reliability, ease demand
on the power grid and increase your energy independence.
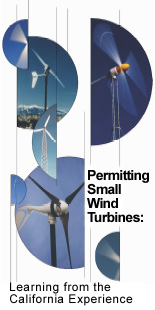
The most comprehensive guide yet for small wind turbine owners
and local officials to understanding and improving permits and
regulations for small wind turbines is now available.
Permitting Small Wind Turbines: Learning from the California
Experience provides up-to-date information to address the most
common issues raised in response to small wind turbine
installations, including visual impacts, acoustics, concern
for wildlife and property values.
Most importantly, the handbook includes a model small wind
zoning ordinance that the American Wind Energy Association recommends
for all counties across the country. It also provides recommendations
for best practices with a list of “dos” and “don’ts” for counties
reviewing small wind permit applications.
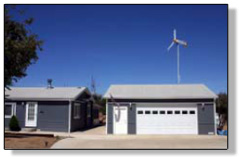
Small home wind turbine
The handbook was written by the American Wind Energy Association
small wind advocate team, in cooperation with Northwest Sustainable
Energy for Economic Development and the California Energy Commission.
On behalf of the U.S. Department of Agriculture and the U.S.
Department of Energy, you are invited to a Renewable Energy and
Energy Efficiency Workshop in Kearney on Friday, April 23 at the
Buffalo County Fairgrounds Exhibit Hall. The workshop is
scheduled from 9:00 a.m.until noon.
Also, from 1:00 to 3:00 p.m., a workshop has been scheduled to
specifically discuss energy grant funds available under Title
Nine from the USDA. This is the second year that these funds
will be available and applications.
Representatives from both the National Renewable Energy Laboratory
and the U.S. Department of Agriculture will be presenters at both
the morning and afternoon sessions.
The latest information on the funds available, submission process
and the closing deadlines can be found at
USDA Farmbill 9006 Resources.
Where: Buffalo Co. Fairgrounds
Nebraska Extension Center Building
1400 East 34th St.
Kearney, Nebraska
Sponsored by:
Department of Energy National Renewable Energy Laboratory
USDA Rural Development
Nebraska Energy Office
Nebraska Value Added Advisory Partnership
INFORMATIONAL WORKSHOP and EXHIBITS
Information from the National Renewable Energy Laboratory on
the latest in Renewable Energy and Energy Efficiency technology.
Actual on-site exhibits and models of Renewable Energy &
Energy Efficiency equipment, products, and technology. Visit with
Renewable Energy Lab personnel on how you can use this technology
in your business or farm. Information and/or exhibits on wind
energy, photovoltaic systems, methane digester systems, other
biomass/biogas systems, and many other products and technologies
for both renewable and energy efficiency projects.
Information from USDA Rural Development and the Nebraska
Energy Office about grants, loans, and other assistance available
for Energy Projects.
Hear from Congressman Tom Osborne (invited) or his staff on
energy policy and the importance of renewable energy and energy
efficiency development in Nebraska!
AGENDA
9:00 A.M. Introduction and National Renewable Energy Lab Presentation
Renewable energy technologies for businesses, farm, & ranch
11:00 A.M. Grant Assistance/ Funding Opportunities Information
11:30 A.M. Congressman Tom Osborne (invited)
Note: The exhibits and personnel will remain available
throughout the noon hour for participants to learn more about the
technologies and grant funding available for projects.
Who Should Attend:
Businesses, Farmers, Ranchers, Utility personnel, Community
representatives, Economic Developers, Chambers, anyone interested in
renewable energy and energy efficiency technology and projects!
No Pre-Registration – COME AND JOIN US
This is a great
opportunity to visit with our National Renewable Energy Lab staff
and to learn about funding opportunities for doing your own
renewable energy or energy efficiency project.
For more information, call USDA Rural Development at 402-223-3125.
This workshop is conducted in cooperation with the Nebraska
Value Added Advisory Partnership value-added workshop being
held on April 22. Attendees at that seminar are urged and invited to
stay over for this valuable energy workshop.
Nebraskans consumed less than four percent of our state's
renewable resources, such as ethanol, wood and wood waste, solar,
hydro power and geothermal energy.
In the face of soaring — and record-breaking — energy prices
in 2000, Nebraskans did what they’ve done before — cut energy use
wherever they could. Despite the 3 percent decline in overall energy
consumption, the price Nebraskans paid soared 21 percent in 2000
reaching $4.3 billion, according to the latest data from the Energy
Information Administration.
The majority of the money in 2000 was spent on petroleum and natural gas
although petroleum and coal were the two most used fuels.
Consumption Drops
In 2000, Nebraskans used 583.5 trillion British thermal units of energy,
which was less than 1 percent of the nation’s consumption and a 3 percent
decrease from Nebraskan’s 1999 consumption of 603.4 trillion British
thermal units. Almost two-thirds of the state’s energy needs were met
by petroleum at 33 percent and coal at 31 percent. Natural gas use was
19 percent and nuclear electric power was 14 percent. Renewable energy,
which consists of hydroelectric power, wood and waste, ethanol,
geothermal, photovoltaic, and solar thermal energy, use was 4 percent
(wind energy was not included in this total).
Economic sector use was relatively equalized with only 10 percent
separating the sectors. Thirty percent of the energy consumed in
Nebraska was used in the transportation sector. The industrial sector
consumed 28 percent, the residential sector consumed 22 percent and
the commercial sector consumed 20 percent.
In 2000, each Nebraskan consumed an average of 341 million British
thermal units, a decrease of 6 percent from 362.2 million British
thermal units in 1999. This level of use was 2 percent lower than the
nation’s consumption per capita of 349 million British thermal units.
Expenditures Soar Past $4 Billion
Nebraskans spent $4.3 billion on energy in 2000, an increase of 21
percent from $3.6 billion in 1999. Ninety-five percent of the $4.3
billion bill went for only two types of energy: petroleum at 73.7
percent and natural gas at 20.7 percent. The balance of the spending
went for coal at 3.8 percent, nuclear fuel at 1.7 percent and less
than 1 percent on renewable energy.
More than two-thirds of Nebraskans'
energy dollars were spent on
non-renewable energy resources
like petroleum and natural gas.
The cost and dependency of the state on petroleum is clearly reflected
in 2000 expenditures. Of the petroleum expenditures of $2.376 billion,
over half — 52 percent — was spent on motor gasoline and another
36 percent was spent on distillate fuel, primarily diesel fuel. Expenditures
for propane, jet fuel, lubricants, asphalt and road oil, residual fuel,
aviation gasoline, other petroleum and kerosene made up the remaining
12 percent.
Wood and waste make up the entire cost associated with renewable energy
since there are no direct fuel costs for hydroelectric, geothermal, wind,
photovoltaic or solar thermal energy. The Energy Information Administration
did not track the cost of ethanol in 2000.
Although consumption was divided relatively equally among the four end-use
sectors, expenditures were not. The transportation sector spending alone
exceeded the total of the next two sectors combined: transportation totaled
44 percent, residential sector totaled 21 percent and the industrial sector
totaled 20 percent. The commercial sector spent the remaining 16 percent.
Getting a National Perspective
In 2000, Nebraska’s $4.3 billion expenditure on energy was less than 1 percent
of the nation’s energy expenditures. Each Nebraskan spent an average of
$2,526 on energy, an increase of $380 — or 18 percent — from
$2,146 in 1999. On a per capita basis, the state’s $2,526 was 1 percent
higher than the national expenditure per capita of $2,499.
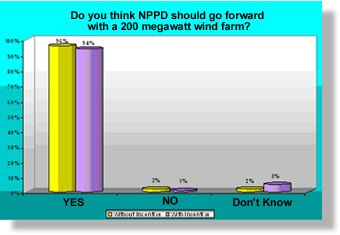
Survey: Should NPPD go forward with
a 200 megawatt wind farm?
The answer? A resounding "Yes !"
The Nebraska Public Power District (NPPD) has a long-term Energy
Supply Strategy to meet customers’ future energy needs and a strategic
goal to add additional renewable energy sources to its power
generation portfolio. Before proceeding with its plans, the
utility’s management wanted to see what the people who ultimately
own the system, use the electricity generated by the power
district, and pay the bills thought of the strategy.
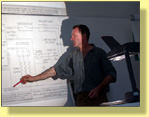
NPPD decided to use Deliberative Polling® to find out
its owners’ thoughts because the method obtains informed public opinion
based on a statistically representative customer sample.
After considering the results, which showed phenomenal support for the
addition of power generation from wind, the NPPD Board of Directors decided
to construct a wind energy facility with 30 megawatts for NPPD, and up
to an additional 45 megawatts depending on finding customers for the
additional wind energy.
A detailed overview of the Deliberative Polling®
process and how it
worked appeared in “21st Century Polling” in the March-April 2004 issue
of Public Power 21st Century Polling.
The results of the polling process is contained in Nebraska Public
Power District Customer Meeting on Energy Alternatives
NPPD Final Report
Grants from the Western Area Power Administration and the Nebraska
Energy Office provided partial support for the project.
Last May, Nebraska joined the other states in the way natural gas
utilities are regulated. The state's Public Service Commission's
regulatory authority was extended to include investor-owned natural
gas systems.
Nebraska Public Service Commission logo
Historically, cities and villages regulated the rates for investor-owned
utilities that provided natural gas to people within the town's boundaries.
There was no local or state regulatory authority for rural natural gas
users. Municipally-owned natural gas systems were regulated the same
as locally-owned electric utilities: by city councils and village boards.
Now, if you have a complaint about your natural gas service you can contact
the Public Service Commission which recently added a complaint form that
is available online at
Nebraska
Public Service Commision Complaint Form.
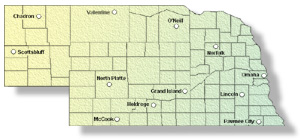
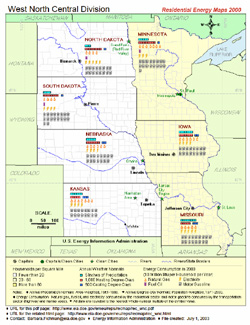
Heating and Cooling Variances Affect Your Energy Bills
Nebraska Heating and Cooling
Degree Days
Locator Map
In the number-numb, glassy-eyed world of energy statistics, sits a
helpful tool to help you answer the question: Is it really colder
than last year? Is this normal weather we’re having? This helpful
database series is called degree days.
But what are degree days?
Degree
days are used to estimate fuel
consumption and to pinpoint the nominal annual heating and cooling
loads of a building. A degree day is a 1 degree Fahrenheit
difference between 65 degrees Fahrenheit and the average outdoor
air temperature on a given day. The more extreme the temperature,
the higher the number of degree days. Degree day measurements can
be used to describe the effect of outdoor temperature on the amount
of energy needed for space heating or cooling. Hot days, which could
require the use of energy for cooling, are measured in cooling degree
days. On a day with an average temperature of 90 degrees Fahrenheit,
25 cooling degree days would be recorded. Cold days are measured in
heating degree days.
For a day with an average temperature of 45 degrees Fahrenheit, 20
heating degree days would be recorded. Two such cold days would result
in a total of 40 heating degree days for the two-day period.
This map links to the U.S. Energy Information Administration Residential
Energy Map for the Midwestern region.
You will find a wealth of information
on heating and cooling degree days for Nebraska and surrounding
states.
Click on the map to visit the Energy Information Administration
web site and find your heating and cooing degree days normals and
annual weather normals.
You may use this map
to look for heating and cooling trends and compare them to surrounding
states. Find how much energy you are using compared to your neighbor's
energy use. Energy consumption and variations in heating and cooling
days help give you a better idea of how weather affects your energy
use and affects the prices you pay for energy.
The map also includes information on state
population, households per square mile, amount of energy used per
household and what type of energy or fuel they used most.
For Nebraska specific information on heating and cooling degree
days and all their permutations, use these links below:
By studying degree day patterns in an area, the increases or
decreases in heating or air conditioning bills can be evaluated
from year to year. The Energy Office maintains degree days and
degree day normals — 30 year averages — for twelve
cities around the state in addition to the state's degree days.
By studying the
locator map,
(above) find the city to which you are closest and use that city's
degree days. Degree day information may also be published in a local
newspaper, usually in the weather section. Information could be
available from a local utility. Its public relations department
may be able to provide the number of degree days in the last
billing period and how it compares to the number of degree days
in previous billing periods.
A Little Heat, A Little Cold
Nebraska's heating degree day normal for a year is 6525 and cooling
degree day normal for a year is 1008. In a year with normal weather,
Nebraskans will heat their homes and businesses 6525 degree days and
cool their homes and businesses 1008 degree days. In comparison,
Hawaii (a hot weather state) has 20 heating degree days and 3002
cooling degree days, and Colorado (a cold weather state) has 7410
heating degree days and 273 cooling degree days.
In the 2002/2003 season, Nebraska's heating degree days totaled
6419 or 105 degree days less than the degree day normal. This
indicates Nebraska's winter was 2 percent warmer than normal. In
2002, Nebraska's cooling degree days totaled 1231 or 223 degree
days more than the degree day normal. This indicates Nebraska's
summer was 22 percent warmer than normal.
Hot Spot, Cold Spot
According to degree day data gathered over a thirty year period,
the city with the most cooling degree days, among the 12 towns
surveyed, is Pawnee City. The leader in heating
degree days is Valentine.
The Nebraska Energy Quarterly
features questions asked about 5% Dollar and Energy Saving Loans
Loan forms may be obtained from participating
enders or the Energy Office, or the agency's web site by
clicking here.
As of March 31, 2004 ...
... 21,658 loans for $168.1 million
Question:
Are loans available for roof and foundation repairs?
Answer:
Roof repair or replacement can be part of an attic or ceiling
insulation project, provided the borrower is adding an additional
R-30 insulation value to the ceiling or attic and the roof needs to
be repaired or replaced to protect the new insulation because the
roof leaks.
Roof repairs are eligible in some cases
Form 2 and Form 2 Roofing are the
application forms needed for these projects and should be completed
and taken to a participating lender, along with a bid for the work.
If a borrower is proposing to add an additional R-5 insulation value
to the foundation or basement walls, the walls may be repaired or
replaced as part of the project if needed to protect or install the
new insulation. Form 2 Siding is used for this type
of project.
If exterior insulation is being added to the walls and needs to be
covered to protect it, then Form 2 Siding needs to
be completed along with Form 2, and taken to the lender when applying
for a loan, along with a bid or bids for all the work.
It also is possible to repair basement and foundation walls as a
"seal air leaks" project on Form 2 without adding additional
insulation. Any necessary tuck pointing would also fit under this
category.
Question:
Are there other funding sources for energy conservation projects
besides Dollar and Energy Saving Loans?
Answer:
Depending on the type of applicant, there may be funding opportunities
through local Community Development Block Grant Programs administered
by cities, counties, and development districts. Other sources could
be the USDA Rural Development or other agencies such as the Library
Commission or the Historical Society. In addition, local utilities
may have rebates available. More than 40 different financing options
are listed in 40 Ways to Finance Your Improvements.
Question:
How can information be obtained on Dollar and Energy Saving Loans?
Answer:
Brochures and application forms can be requested from the Energy
Office or can be viewed and downloaded from the agency's
web site.
Question:
Can drilling a new well be covered by a Dollar and Energy Saving Loan?
Well drilling rig
Answer:
In some cases, a new well which is to be part of an irrigation project
could be eligible when the new well and equipment are replacing an
existing well and equipment and will generate enough in energy dollar
savings to recover the cost of the new well and equipment in 10 years
or sooner. This could hold true for other types of new wells and
equipment in businesses, homes or agricultural operations provided
they met the same payback criteria.
These types of projects must be supported by an energy audit.
Form 32 and Form 33 can be used for
this audit.
Drilling a new well can be funded also with an energy loan as part of
a ground source heat pump system which is going to be installed to
replace the existing system in a home or building. These wells would
be part of a heating and cooling project which is found on
Form 3.
Question:
I am interested in building a wind farm in Nebraska. Can I get a
Dollar and Energy Saving Loan for the project?
Answer:
Getting a loan for a wind farm in Nebraska would have to be done by
an eligible borrower; be located in Nebraska; demonstrate through a
technical audit that it would provide sufficient energy dollar savings
in the operation to qualify the project; and be limited by the dollar
amount for that loan sector.
These requirements are the same for any type of renewable energy
project. Residency requirements for borrowers, payback criteria and
loan sector limits can be found on the Energy Office's web site or
by requesting a loan brochure from the Energy Office.
Typically borrowers need to be a Nebraska resident or entity. Loan
limits range from $35,000 for a single family dwelling up to $175,000
for a political subdivision. The payback criteria are 10 years for
system improvements and 15 years for building improvements.
For renewable energy projects such as a wind farm,
Form 32 and Form 33 should be used
for submitting an energy audit for the Energy Office's review.
Question:
Are 5% Dollar and Energy Saving Loans available for the purchase of
dual fuel vehicles that are now being manufactured?
Answer:
E-85 ethanol fueled
vehicles save on fuel costs
and improve air quality
Loans are available for the incremental cost of a dual fuel vehicle.
This would be the difference in the cost of the vehicle versus the
cost of the same vehicle without alternate fuel capability. These
types of loans can be made for a term of three years. The full cost
of a vehicle is eligible for a loan only if it is a dedicated —
100% ethanol, bio-diesel, propane, natural gas or electric —
alternate fuel vehicle. These types of loans can be made for a term
of 5 years if the vehicle is under 8,500 lbs. gross vehicle weight,
and for a term of seven years if over that weight. The loans cannot
retroactively fund the purchase of an eligible vehicle. Form 7 is
the application form used for alternate fueled vehicle projects
Form 7.
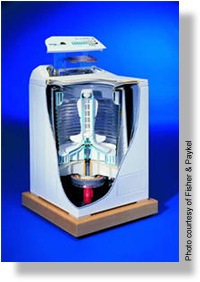
Editor’s Note: An Energy Office staff member
tested this new type of washer and offered his assessment.
Which is Best?
You Decide
American Council for an
Energy-Efficient Economy
(ACE³) logo
The American Council for an Energy-Efficient Economy (ACE³)
web site lists the most efficient washers on the market today.
Washers are listed in order of efficiency.
High Efficieny Clothes Washers aer also listed at the ENERGY
STAR® web site.
Efficient Washers can save you up to half the cost of water and
electricity normally used for washing. Look for the ENERGY
STAR® logo.
For people not familiar with the latest in clothes washing technology,
there’s a new type on the market, which claims energy, and thus energy
dollar savings.
Efficient washer top with
the ENERGY STAR® logo
The source of the savings is a faster spin cycle, which
supposedly squeezes more water out of the clothes at the end of the wash.
With less water in the clothes at the end of the cycle, the clothes dryer
has less work to do, and as a result, you save energy and money. There
is also the added feature that the clothes in the dryer are done by the
time the next load is done, which means less time spent on this task.
The Review...
Our family recently purchased one of these new clothes washers. It’s a lesser
known top loading unit, that was actually half the cost of some name brand
front loading models with the same “faster spin cycle” feature. The price
was comparable to other models on the market which did not offer the faster
spin cycle.
Efficient washer cut away
Testing the Technology
The day after installation, the new clothes washer got its first test. I
was a bit nervous about how our purchase would work. Would it actually spin
the clothes dryer than a standard unit?
Had a mistake been made in not going
with a name brand? So on this particular day, I’m making intermittent calls
home for a wash day update.
The answer to my first call was a don’t bother me type of “Yes it’s doing
fine!” The answer to my second call was a quizzical, and alarming, “Well
the washer seems to be O.K., but the dryer doesn’t seem to be working right!”
Thinking to myself, ‘great, more repairs,’ I asked, “Why what’s wrong with
the dryer?” “Well, when I remove the clothes from the dryer, they aren’t
hot,” was the reply.
Wet Clothes?
With a picture of damp clothes hanging on a line, my first thought was that
another high temperature switch needed replacement, which I’ve had to do
in the past. Then it dawned on me: the dryer had a cool down cycle! I asked
if the clothes were dry coming out of the dryer, and received an affirmative
answer.
This dryer had been in use for about ten years, but had never been able
to take a second load of clothes from the washer without waiting on the
dryer to finish it’s cycle, usually taking the clothes out while they were
still hot. We had all forgotten about the cool down cycle.
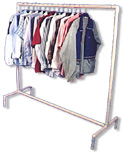
“I was a bit nervous about how our purchase would work.”
Clothes hanging
on a rack
The new washer had not only removed enough water for the first load
of clothes to be dry when the second load was finished washing, it
had also allowed enough time for the dryer to go into the cool down
cycle. Yet another added bonus: clothes have fewer wrinkles when the
cool down cycle is used.
Would this new washing style add more stress to the clothes, causing them
to fade faster, or tear sooner? I’m happy to report that we’ve had our new
washer for several months and have not noticed any increase in fading or
wear.
Does the new style of clothes wash does save energy? Yes, and it also saves
wash day time, saves wear on your dryer by reducing it’s run time, can be
purchased for about the same money as a conventional washer, and in our
case, gives us less wrinkles.
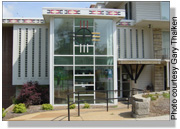
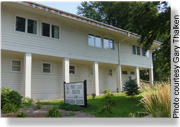
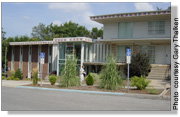
$45,373 To Ponca Tribe For Improvements at Fred Leroy Health Center in Omaha
New Windows and Lights All Around
Leroy Health Center
Front entrance
The Fred Leroy Health & Wellness Center provides medical and dental
services and health and disease prevention education to Native
Americans. The Center serves the urban Native American population
of Omaha.
Rear view of health center
The clinic opened in 1998. It offers ambulatory medical care, midwife
service, physical and occupational therapy, a well child clinic,
WIC program, dental clinic, laboratory services, home health services,
nutrition counseling and traditional Native American healing.
Front view of health center shows
old and new building sections
Transportation to and from the clinic is provided for elderly and
disabled persons and others without means of transportation. A
Creighton faculty member is the medical director and on-site
physician.
Governor Mike Johanns announced the Ponca Tribe of Nebraska will
receive a $45,373 grant from Nebraska Energy Office’s oil overcharge
trust funds for a series of energy saving improvements at the Fred
Leroy Health Center in Omaha.
The Health Center provides
medical and dental services
and health and disease
prevention education to
Omaha area Native Americans
According to the Energy Office, this project uses the remaining oil
overcharge funds earmarked for Native American tribes in the state.
All the improvements should be completed before next winter’s
heating season when the Center’s heating costs should be
substantially reduced.
The improvements planned for the Health Center include replacing 57
single-paned windows with double-paned, low-infiltration, vinyl
framed windows and replacing 78 light fixtures with ones utilizing
electronic ballasts and fewer fluorescent tubes, but with improved
light output. Most of the windows being replaced are the original
ones in the 1954 portion of the building. Estimated annual savings
for the improvements total $1,771.
Any remaining funds will be used to replace one or more cooling
units at the Center, or make improvements in the Ponca’s tribal
building in Lincoln.
The Energy Office’s oil overcharge trust funds are a result of
various court settlements against oil companies that overcharged
their customers during the period of federal price controls from
1973-1981. The courts established parameters for use of the funds
and included restitution to Native American tribes.
Previously, the Energy Office provided grants for weatherization
of Winnebago tribal buildings and improvements in Omaha- and
Santee Sioux-owned housing.
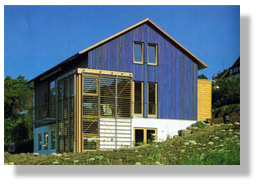
If you are thinking about buying a solar electric
system for your home or business, this booklet provides basic
information that can help you.
This publication
introduces consumers to photovoltaic technologies and guides them through
the basics of the technology including how to purchase solar electric systems
and what todo before a system can be connected to the utility grid system.
This publication was written for the California Energy Commission and partially
funded by the National Renewable Energy Laboratory.
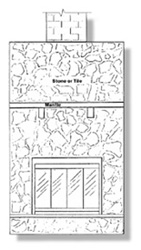
This long out-of-print publication (published circa 1981)
is a "how-to" manual on how to construct a high efficiency fireplace
that incorporates the best qualities of a Finnish or Russian
fireplace and that of the typical open American type.
This fireplace design can be accommodated in spaces where
conventional fireplaces are now used. This booklet was prepared
by Southeast Community College — Beatrice Campus for the
Nebraska Energy Office.
This interactive web site sponsored by the U.S.
Department of Housing and Urban Development offers recommendations
based on ENERGY STAR® specifications for
any type of renovation project in single family and muti-family
housing, either publicly or privately owned.
ENERGY STAR® is the government-backed
symbol for energy efficiency.
The Rehab Advisor provides advice for making housing that is
energy efficient, durable, sustainable and healthy. The site
provides options for the type of housing, the local climate
and the age of the building. The Advisor includes areas dealing
with freezing problems, operating costs, indoor air quality,
maintenance, durability, comfort, water use and more.
This report is the third since the passage of LB 901 that required
an annual assessment of the state of electric restructuring activity in
the region and its potential impact on the publicly owned electric systems
in Nebraska.
This newly updated publication — the 15th edition — provides
a list of generally free or low cost energy related education materials
available for students and educators. Compiled by the U.S. Department
of Energy’s Energy Information Administration.
Should there be a space between the concrete wall and the
frame wall I am installing in my basement? Also, what kind of
insulation should I use in between the wall framing?
Should I also use a poly vapor barrier behind/between
the frame wall and the concrete wall? Thank you for your time.
-- Mr. Williams
Answer:
Dear Mr. Williams,
The biggest problem associated with insulating basement walls is the
possibility of getting moisture behind the insulation. The moisture can
come from inside the house in the form of condensation on a cold basement
wall, and moisture from outside the home that does not drain away from
the house and seeps through the basement wall. The important thing to
realize here is that concrete and gypsum board are not vapor barriers,
most molds feed on cellulose products, such as wood, and molds like
dark places. Since you can't control the light behind a wall (it will
be dark), you need to control the moisture or what the mold feeds on.
Now almost any insulation can be used, even blown in cellulose provided
it has been treated to prevent mold growth. We have seen a number of
basement wall installations use a product called polyisocyanurate,
which is an insulation board, with an R-value of about R-7 per inch of
thickness (ie...R-14/2inch, R-21/3inch, etc.). This was recommended as
a best practice solution at a recent workshop, foil faced polyiso
board applied directly against the basement wall, followed by a 2x2
or 2x4 framing over the polyiso. Another best practice is the use of
steel or alluminum framing members instead of wood over the polyiso.
The foil facing on these boards provides a vapor barrier and drainage
plain for any moisture that might condense on the basement wall or
come through the basement wall from the outside. It is also recommended
that the gyp board be left 1/2" off the floor to keep it out of any
moisture that might drain down the wall.
In the following list of web sites, there is some good information at
Advanced Energy.org
on insulating basements,
but please be reminded that a lot of this work has been done in the
southern part of the country where the emphasis is on high humidity
in a warmer climate. I believe that in our area, any problems with
moisture in a basement or crawlspace will likely come from condensation
on a cold basement wall.
Please also make sure that your home has good drainage away from the
basement walls on the outside of the home.
Visit these web sites for information on moisture and mold:
The Energy Wiz recently received several questions about biomass from
a 6th grade student.
Here are the Wiz’s responses:
Dear Energy Wiz,
Question 1:
What kind of waste does biomass produce, if it does?
Answer 1:
First of all there are many types of biomass fuels, and
different ways to produce energy from it. Probably the
most common form of biomass energy is ethanol. Gasoline
with ethanol can be found at most service stations. Ethanol
can be burned in some special cars by itself, instead of
gasoline, but most often it is mixed with gasoline, and
that can be burned in any car. Ethanol is a type of
alcohol and burns very clean when compared to gasoline.
Ethanol can be made from a number of different biomass
products. Corn is the major source of today’s
ethanol, but ethanol can also be made from sugar cane,
a number of different grasses, and various stovers
(Stover is what is left in the field after a farmer
takes the grain from the field).
Biomass energy can also be produced from burning waste products such as
stover, wood or wood waste. This type of biomass energy is produced in
a couple of different ways. One way to produce energy from stover or
wood waste is to burn it straight from the field, forest, or from saw
mill wood waste just by making a fire from it. When wastes are burned
in this way, other waste byproducts such as carbon monoxide (CO),
carbon dioxide (CO2), and nitrous oxide (NOx) are produced. Just
burning biomass by making a fire is not a very clean or efficient
was to utilize this energy resource.
Another way to get the energy from stovers, wood, and wood waste, is
to burn it slowly in an air tight room. As you probably know, a fire
needs air to burn. If you put biomass in an air tight room, and only
give it a little bit of air, it burns very slowly, like the coals in
a grill, and gives off a gas that will also burn if you give it more
air. That process is called gasification, and is a cleaner way of
burning biomass. The gas that is given off using this gasification
process can actually be burned in an engine like the one in your
parents’ car, but to do that, the car would need to have some
special things added to it which would cost a lot of money. What
usually happens is that the gas that this burning process gives
off is burned in a special engine right where the gas is made.
That special engine then turns a shaft on a machine called a
generator, and that generator makes electricity. Here, too,
there are emissions, or pollution, but the emissions are more
like those of a car.
Another type of biomass energy comes from the excrement from farm
animals (the stuff that's left when farm animals go to the bathroom).
Some farms use a machine called a digester to make energy from this
animal waste. There are also some cities that make energy from human
waste in this manner. What happens, is that the waste is gathered,
usually by washing the pens that the animals live in. Then the waste
goes into a type of drain or sewer, kind of like the sewers in town,
and finally to the digester. Once the waste is in the digester, bacteria
and enzymes work on the waste and give off a gas called methane. Again,
this is not a liquid gas, but more of a gas like the air we breathe,
except that it will burn. This gas also is usually burned in an engine
that turns a generator which, in turn, makes electricity. The emissions,
or pollution, from burning this gas are usually pretty clean. We still
get some pollution, but less than what comes from a car that burns
gasoline.
One other biomass energy source is biodiesel. Most trucks on the
highway burn a liquid called diesel fuel. A farm product called
soybeans can be made into a liquid that is just like diesel fuel,
and can be burned in those same trucks. You can also make biodiesel
from animal fat, such as the waste grease that a restaurant used to
cook french fries. The pollution from engines that burn biodiesel
is almost the same as the pollution that comes from burning regular
diesel fuel, with some positive differences. The advantages are
less sulfur dioxide (SOx) is produced and biodiesel helps lubricate
the engine, which makes it last longer.
Dear Energy Wiz,
Question 2:
What risks are there with biomass energy?
Answer 2:
The risks are very similar to the risks that we see in other things
we do every day. With ethanol, the risk might be that a food product
is converted to an energy product. But not all of the corn turns into
energy. Much of what is left of the corn is still made into food
products. The same is true of using soybeans to make biodiesel. Of
course, using waste grease from a restaurant to make biodiesel is
a good thing since the waste grease would otherwise go into a
landfill or sewer. Using animal waste to make gas for burning
is also a good thing. Animal waste usually has a bad odor, but
when it is put in a digester to make "biogas," it takes
the odor away, and what is left is a kind of dirt that is good
to put on gardens or farmland and helps plants grow.
Your Friend,
The Energy Wiz
Editor's Note:
The staff at the Energy Office respond to many inquiries
on a variety of topics from Nebraskans. From time to
time, the Quarterly will share some questions
— and the answers — with readers.
In accordance with the American Disabilities
Act, the state will provide reasonable
accommodation to persons with disabilities. If
you need reasonable accommodation to participate
in any program or activity listed in this
publication, please contact the Energy Office
at 402-471-2186 to coordinate arrangements.
Upon request, this publication may be available
in alternative formats.
This material was prepared with the support of
the U.S. Department of Energy (DOE) Grant No.
DE-FG47-92CE60410. However, any opinions, findings,
conclusions, or recommendations expressed herein
are those of the author and do not necessarily
reflect the views of DOE.