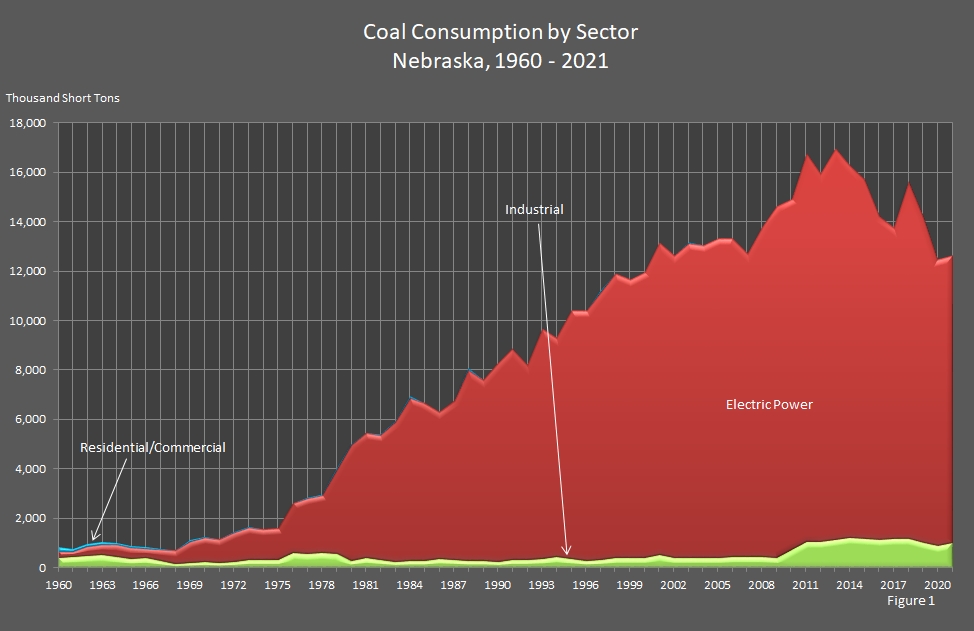
Nebraska used 12,602 thousand (12.6 million) short tons of coal in 2021, an increase of 1.2 percent from 2020. Coal used for electricity generation accounted for nearly all (92.0 percent) of the consumption with 7.7 percent consumed in the industrial sector. Any coal consumption in the commercial, transportation, and residential sectors was small enough to round to zero in this table.
Nebraska Department of Environment and Energy
Air Water Land Energy
Nebraska Energy Statistics
Coal Consumption in Nebraska
by Sector
| Year | Sectors | Total | ||||
|---|---|---|---|---|---|---|
| End–Use Sectors | Electric
Power |
|||||
| Commercial | Industrial | Residential | Transportation | |||
| 2021 | 0 | 976 | 0 | 0 | 11,626 | 12,602 |
| 2020 | 0 | 870 | 0 | 0 | 11,587 | 12,457 |
| 2019 | 0 | 1,007 | 0 | 0 | 13,149 | 14,156 |
| 2018 | 0 | 1,138 | 0 | 0 | 14,443 | 15,581 |
| 2017 | 0 | 1,173 | 0 | 0 | 12,570 | 13,743 |
| 2016 | 0 | 1,113 | 0 | 0 | 13,056 | 14,169 |
| 2015 | 0 | 1,175 | 0 | 0 | 14,508 | 15,683 |
| 2014 | 0 | 1,217 | 0 | 0 | 15,036 | 16,253 |
| 2013 | 0 | 1,124 | 0 | 0 | 15,829 | 16,953 |
| 2012 | 0 | 1,038 | 0 | 0 | 14,884 | 15,922 |
| 2011 | 0 | 1,039 | 0 | 0 | 15,711 | 16,750 |
| 2010 | 0 | 698 | 0 | 0 | 14,167 | 14,865 |
| Year | Sectors | Total | ||||
|---|---|---|---|---|---|---|
| End–Use Sectors | Electric
Power |
|||||
| Commercial | Industrial | Residential | Transportation | |||
| 2009 | 0 | 392 | 0 | 0 | 14,183 | 14,575 |
| 2008 | 0 | 415 | 0 | 0 | 13,360 | 13,776 |
| 2007 | 5 | 427 | 1 | 0 | 12,267 | 12,699 |
| 2006 | 5 | 420 | 0 | 0 | 12,881 | 13,307 |
| 2005 | 3 | 393 | 0 | 0 | 12,886 | 13,283 |
| 2004 | 3 | 371 | 0 | 0 | 12,650 | 13,023 |
| 2003 | 5 | 385 | 1 | 0 | 12,725 | 13,115 |
| 2002 | 6 | 388 | 1 | 0 | 12,210 | 12,605 |
| 2001 | 5 | 518 | 1 | 0 | 12,606 | 13,130 |
| 2000 | 0 | 407 | 0 | 0 | 11,503 | 11,910 |
| 1999 | 0 | 405 | 0 | 0 | 11,219 | 11,625 |
| 1998 | 0 | 384 | 0 | 0 | 11,505 | 11,889 |
| 1997* | 105* | 296 | 13 | 0 | 10,796 | 11,210 |
| 1996 | 1 | 286 | 0 | 0 | 10,091 | 10,379 |
| 1995 | 8 | 339 | 1 | 0 | 10,048 | 10,396 |
| 1994 | 6 | 414 | 1 | 0 | 8,879 | 9,300 |
| 1993 | 4 | 364 | 1 | 0 | 9,297 | 9,666 |
| 1992 | 5 | 325 | 1 | 0 | 7,881 | 8,212 |
| 1991 | 9 | 324 | 2 | 0 | 8,524 | 8,859 |
| 1990 | 3 | 235 | 1 | 0 | 8,027 | 8,266 |
| Year | Sectors | Total | ||||
|---|---|---|---|---|---|---|
| End–Use Sectors | Electric Power |
|||||
| Commercial | Industrial | Residential | Transportation | |||
| 1989 | 4 | 279 | 1 | 0 | 7,303 | 7,587 |
| 1988 | 35 | 268 | 10 | 0 | 7,744 | 8,057 |
| 1987 | 3 | 312 | 1 | 0 | 6,428 | 6,744 |
| 1986 | 3 | 339 | 1 | 0 | 5,945 | 6,288 |
| 1985 | 9 | 261 | 3 | 0 | 6,380 | 6,653 |
| 1984 | 73 | 280 | 17 | 0 | 6,569 | 6,939 |
| 1983 | 47 | 216 | 9 | 0 | 5,656 | 5,928 |
| 1982 | 22 | 325 | 5 | 0 | 5,048 | 5,399 |
| 1981 | 13 | 376 | 3 | 0 | 5,067 | 5,459 |
| 1980 | 15 | 269 | 4 | 0 | 4,702 | 4,990 |
| 1979 | 48 | 538 | 12 | 0 | 3,461 | 4,058 |
| 1978 | 18 | 576 | 5 | 0 | 2,367 | 2,967 |
| 1977 | 12 | 553 | 5 | 0 | 2,277 | 2,846 |
| 1976 | 7 | 604 | 3 | 0 | 2,012 | 2,626 |
| 1975 | 6 | 308 | 3 | 0 | 1,278 | 1,595 |
| 1974 | 9 | 319 | 4 | 0 | 1,228 | 1,561 |
| 1973 | 14 | 312 | 8 | 0 | 1,350 | 1,685 |
| 1972 | 24 | 218 | 18 | 0 | 1,228 | 1,488 |
| 1971 | 17 | 193 | 17 | 0 | 947 | 1,174 |
| 1970 | 16 | 240 | 20 | 0 | 1,006 | 1,283 |
| 1969 | 31 | 174 | 40 | 0 | 901 | 1,146 |
| 1968 | 16 | 159 | 20 | 0 | 534 | 729 |
| 1967 | 14 | 254 | 19 | 1 | 501 | 789 |
| 1966 | 20 | 395 | 27 | 1 | 417 | 860 |
| 1965 | 26 | 349 | 35 | 1 | 486 | 896 |
| 1964 | 32 | 447 | 44 | 2 | 501 | 1,026 |
| 1963 | 45 | 498 | 62 | 2 | 465 | 1,073 |
| 1962 | 63 | 468 | 91 | 2 | 388 | 1,012 |
| 1961 | 60 | 449 | 87 | 2 | 209 | 808 |
| 1960 | 89 | 408 | 129 | 7 | 256 | 888 |
Sources: State Energy Data Report. Energy Information Administration, Washington, DC. Nebraska Department of Environment and Energy, Lincoln, NE.
Notes: Totals may not equal the sum of the components due to independent rounding.
* For 1997, the Energy Information Administration numbers show 105 for the commercial sector, 296 for the industrial sector, and 13 for the residential sector when all three numbers should have been allocated to the industrial sector.
The table and graph were updated on January 9, 2024.
Typically, there are one to two years between updates.