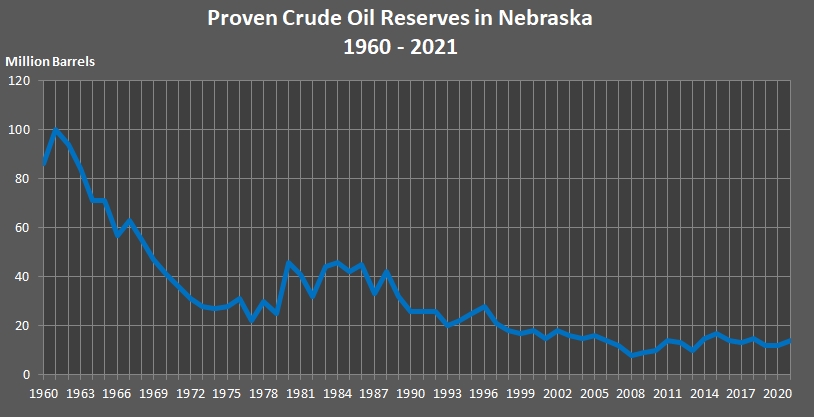
The estimated quantity of crude oil which geological and engineering data demonstrate with a given probability to be recoverable in the future assuming current costs of operation and market prices are proven reserves. Nebraska's reserves are given for 1960 to 2021 in the table below. Proven reserves peaked in 1961 at 100 million barrels.
Nebraska Department of Environment and Energy
Air Water Land Energy
Nebraska Energy Statistics
Nebraska's Proven Crude Oil Reserves
| Year | Reserves | Year | Reserves | Year | Reserves | Year | Reserves | Year | Reserves | Year | Reserves | Year | Reserves | ||||||
|---|---|---|---|---|---|---|---|---|---|---|---|---|---|---|---|---|---|---|---|
| 1960 | 86 | 1970 | 41 | 1980 | 46 | 1990 | 26 | 2000 | 18 | 2010 | 10 | 2020 | 12 | ||||||
| 1961 | 100 | 1971 | 36 | 1981 | 41 | 1991 | 26 | 2001 | 15(1) | 2011 | 14 | 2021 | 14 | ||||||
| 1962 | 94 | 1972 | 31 | 1982 | 32 | 1992 | 26 | 2002 | 18 | 2012 | 13 | 2022 | NA | ||||||
| 1963 | 84 | 1973 | 28 | 1983 | 44 | 1993 | 20 | 2003 | 16 | 2013 | 10 | 2023 | NA | ||||||
| 1964 | 71 | 1974 | 27 | 1984 | 46 | 1994 | 22 | 2004 | 15 | 2014 | 15 | 2024 | NA | ||||||
| 1965 | 71 | 1975 | 28 | 1985 | 42 | 1995 | 25 | 2005 | 16 | 2015 | 17 | 2025 | NA | ||||||
| 1966 | 57 | 1976 | 31 | 1986 | 45 | 1996 | 28 | 2006 | 14 | 2016 | 14 | 2026 | NA | ||||||
| 1967 | 63 | 1977 | 22 | 1987 | 33 | 1997 | 21 | 2007 | 12 | 2017 | 13 | 2027 | NA | ||||||
| 1968 | 55 | 1978 | 30 | 1988 | 42 | 1998 | 18 | 2008 | 8 | 2018 | 15 | 2028 | NA | ||||||
| 1969 | 47 | 1979 | 25 | 1989 | 32 | 1999 | 17 | 2009 | 9 | 2019 | 12 | 2029 | NA |
Sources: U.S. Crude Oil and Natural Gas Proved Reserves. Energy Information Administration, Washington, DC. Nebraska Department of Environment and Energy, Lincoln, NE.
Note: (1)The estimate is less accurate than previous years' estimates, because the level of information is inadequate.
This table was updated on January 23, 2023.
Typically, there is one year between updates.