Nebraska Department of Environment and Energy

Air Water Land Energy

Nebraska Energy Statistics

Natural Gas Wellhead Prices
in Nebraska

This report has been discontinued.

Note: The average wellhead price of natural gas is unavailable for 2006 and is estimated for 2007 and 2008.

chart showing Nebraska's Natural Gas Wellhead Prices 1960 through 2010.

Return to top of page

Nebraska's Natural Gas Wellhead Prices
1960 – 2010

(Price per Thousand Cubic Feet)

Year Price Year Price Year Price Year Price Year Price Year Price
1960 $0.18 1970 $0.17 1980 $0.83 1990 $2.26 2000 $2.26 2010 $3.98
1961 $0.17 1971 $0.18 1981 $1.45 1991 $2.06 2001 $2.16 2011 NA
1962 $0.18 1972 $0.18 1982 $1.99 1992 $1.78 2002 $1.52 2012 NA
1963 $0.19 1973 $0.18 1983 $2.93 1993 $1.81 2003 $3.17 2013 NA
1964 $0.15 1974 $0.34 1984 $2.24 1994 $1.60 2004 $3.22 2014 NA
1965 $0.15 1975 $0.54 1985 $3.01 1995 $1.19 2005 $4.29 2015 NA
1966 $0.16 1976 $0.51 1986 $2.82 1996 $1.43 2006 NA 2016 NA
1967 $0.17 1977 $0.65 1987 $2.42 1997 $1.53 2007 E$4.86 2017 NA
1968 $0.18 1978 $0.68 1988 $2.66 1998 $1.30 2008 E$6.22 2018 NA
1969 $0.17 1979 $0.85 1989 $2.23 1999 $1.36 2009 $2.97 2019 NA

Return to top of page

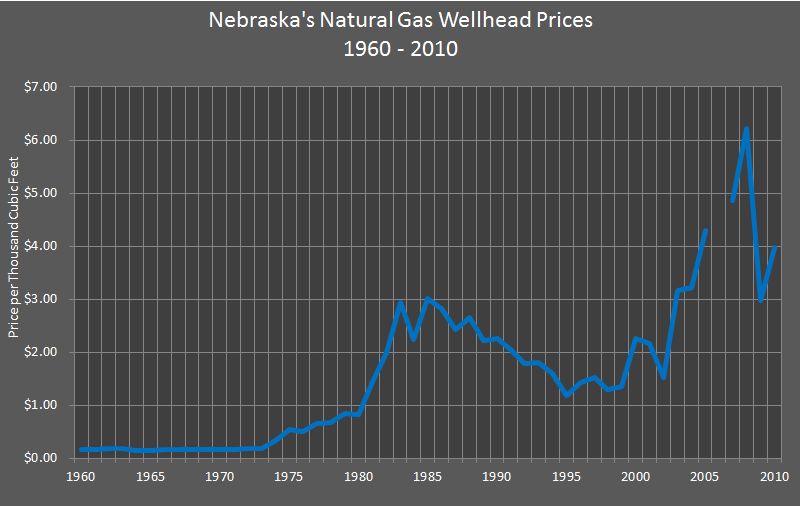
Sources: Natural Gas Annual. Energy Information Administration, Washington, DC. Nebraska Department of Environment and Energy, Lincoln, NE.

Notes: NA = Not Available. E = Estimated.

The table and graph were updated on April 26, 2012.

Return to top of page