Nebraska Department of Environment and Energy

Air Water Land Energy

Nebraska Energy Statistics

Energy Expenditures in
Nebraska's Transportation Sector

The transportation sector consists of private and public vehicles that move people and commodities. Included are automobiles, trucks, buses, motorcycles, railroads, aircraft, ships, barges, and natural gas pipelines. Natural gas use reflects the fuel needed to move natural gas through a pipeline to end users in the residential, commercial, industrial, and electric power sectors. Since 1990, natural gas consumption also includes natural gas consumed as vehicle fuel.

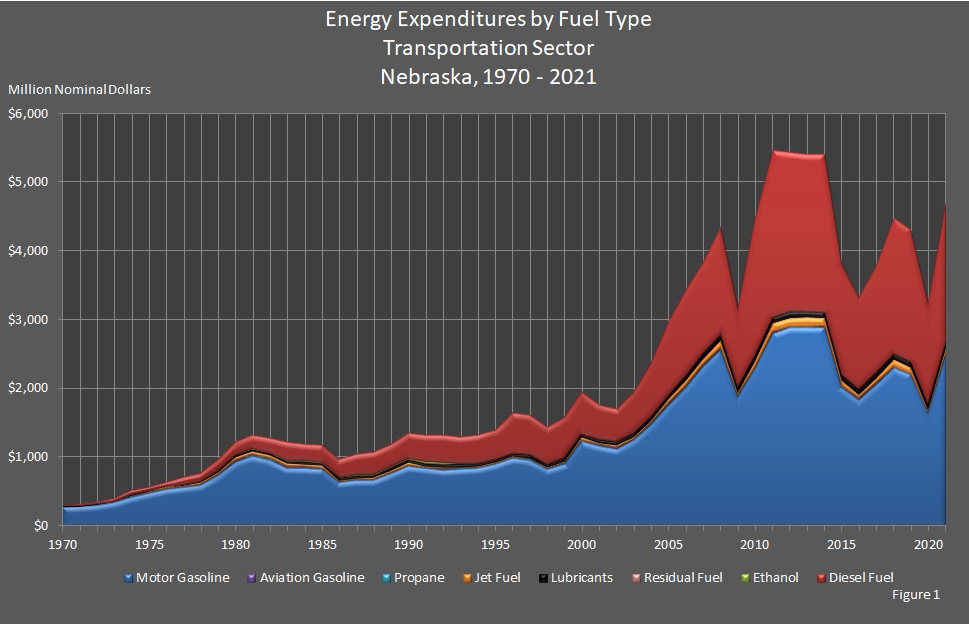
Total transportation sector expenditures on energy increased 45 percent to $4,709.1 million ($4.7 billion) from 2020 to 2021. In 2021, the transportation sector spent $2,482.4 million ($2.5 billion) for motor gasoline, $2,028.7 million ($2.0 billion) for diesel fuel, $90.9 million for lubricants, $87.7 million for jet fuel, $8.2 million for propane, $6.1 million for natural gas, and $5.0 million for aviation gasoline. In 2021, if there were any expenditures on coal, electricity, or residual fuel in the transportation sector, the amounts were so small that the numbers rounded to zero in this table. The expenditures on ethanol were not tracked.

Motor gasoline (53 percent) and diesel fuel (43 percent) expenditures comprised almost all of the money spent in the transportation sector on energy in 2021. Expenditures on lubricants were 1.9 percent and jet fuel were 1.9 percent of the total while each of the other fuels' expenditures was less than 1 percent.

The expenditures are in nominal dollars to provide a better comparison.

Return to top of page

graphic showing Energy Expenditures by Fuel Type in the Transportation Sector in Nebraska.

Return to top of page

Nebraska Energy Expenditures
by Fuel Type, Transportation Sector
2010 – 2021

(Million Nominal Dollars)

Year Coal Electricity Natural
Gas
Petroleum Renewable Annual
Total
Aviation
Gasoline
Diesel
Fuel
Jet
Fuel
Lubri­cants Motor
Gasoline
Propane Residual
Fuel
Fuel
Ethanol
2021 $0.0 $0.0 $6.1 $5.0 $2,028.7 $87.7 $90.9 $2,482.4 $8.2 $0.0 NA $4,709.1
2020 $0.0 $0.0 $2.2 $4.0 $1,482.5 $44.8 $82.0 $1,634.7 $0.3 $0.0 NA $3,250.5
2019 $0.0 $0.0 $2.2 $4.8 $1,922.3 $94.3 $89.0 $2,187.9 $2.1 $0.0 NA $4,302.7
2018 $0.0 $0.0 $2.2 $5.1 $1,985.9 $71.0 $87.9 $2,288.8 $1.4 $0.0 NA $4,442.2
2017 $0.0 $0.0 $1.4 $4.7 $1,555.1 $50.7 $84.0 $2,050.3 $0.2 $0.0 NA $3,791.7
2016 $0.0 $0.0 $1.8 $4.0 $1,345.8 $33.2 $89.8 $1,832.8 $0.3 $0.0 NA $3,347.5
2015 $0.0 $0.0 $1.1 $4.2 $1,615.6 $50.4 $122.3 $2,008.9 $6.8 $0.0 NA $3,835.8
2014 $0.0 $0.0 $0.8 $6.4 $2,292.4 $67.4 $115.9 $2,875.6 $16.7 $0.0 NA $5,433.8
2013 $0.0 $0.0 $0.9 $5.7 $2,281.1 $91.1 $111.1 $2,873.5 $14.1 $0.0 NA $5,425.4
2012 $0.0 $0.0 $0.6 $7.3 $2,322.8 $74.8 $109.1 $2,871.2 $3.7 $0.0 NA $5,432.1
2011 $0.0 $0.0 $0.6 $7.4 $2,427.3 $77.8 $114.3 $2,789.3 $3.8 $0.0 NA $5,450.4
2010 $0.0 $0.0 $0.3 $6.0 $1,988.2 $57.5 $91.2 $2,275.0 $4.5 $0.0 $110.5 $4,454.7

Return to top of page

Nebraska Energy Expenditures
by Fuel Type, Transportation Sector
1990 – 2009

(Million Nominal Dollars)

Year Coal Electricity Natural
Gas
Petroleum Renewable Annual
Total
Aviation
Gasoline
Diesel
Fuel
Jet
Fuel
Lubri­cants Motor
Gasoline
Propane Residual
Fuel
Fuel
Ethanol
2009 $0.0 $0.0 $0.2 $6.5 $1,168.2 $48.2 $87.4 $1,869.4 $2.0 $0.0 $83.9 $3,181.9
2008 $0.0 $0.0 $0.3 $9.1 $1,572.5 $113.6 $95.6 $2,557.0 $3.3 $0.0 $115.6 $4,351.3
2007 $0.0 $0.0 $0.2 $9.5 $1,326.3 $87.8 $88.1 $2,306.0 $3.8 $0.0 $58.3 $3,821.8
2006 $0.0 $0.0 $0.2 $9.0 $1,252.0 $88.4 $79.4 $1,997.3 $3.1 $0.0 $28.3 $3,429.4
2005 $0.0 $0.0 $0.2 $7.7 $1,076.4 $69.9 $65.4 $1,757.7 $1.9 $0.0 $25.3 $2,979.2
2004 $0.0 $0.0 $0.4 $4.3 $794.9 $45.7 $56.2 $1,465.6 $4.0 $0.0 $40.3 $2,371.1
2003 $0.0 $0.0 $0.3 $5.1 $606.1 $45.0 $53.3 $1,241.1 $3.1 $0.0 $36.4 $1,954.0
2002 $0.0 $0.0 $0.2 $5.0 $481.1 $47.1 $53.2 $1,116.4 $2.5 $0.0 $29.7 $1,705.5
2001 $0.0 $0.0 $0.3 $4.8 $511.6 $37.5 $49.4 $1,161.5 $2.1 $0.0 $25.0 $1,767.1
2000 $0.0 $0.0 $0.2 $3.5 $624.8 $47.2 $51.1 $1,229.6 $1.6 $0.0 $31.7 $1,957.9
1999 $0.0 $0.0 $0.1 $3.2 $600.4 $36.2 $51.5 $898.9 $0.7 $0.0 $17.2 $1,591.1
1998 $0.0 $0.0 $0.1 $2.6 $556.7 $21.4 $47.4 $821.7 $1.0 $0.0 $13.6 $1,450.9
1997 $0.0 $0.0 $0.9 $4.2 $584.5 $28.0 $46.1 $953.3 $3.4 $0.0 $15.3 $1,620.4
1996 $0.0 $0.0 $0.2 $3.5 $605.0 $27.9 $43.3 $976.2 $1.1 $0.0 $14.0 $1,657.0
1995 $0.0 $0.0 $0.1 $3.2 $444.0 $22.7 $44.8 $890.5 $1.0 $0.0 $19.9 $1,406.4
1994 $0.0 $0.0 $0.1 $3.0 $416.6 $28.1 $45.5 $833.0 $3.6 $0.0 $16.7 $1,330.0
1993 $0.0 $0.0 $0.1 $3.0 $405.2 $27.8 $44.9 $825.4 $1.9 $0.0 $24.4 $1,308.3
1992 $0.0 $0.0 $0.1 $3.5 $407.4 $30.7 $44.3 $813.8 $2.1 $0.0 $29.6 $1,331.5
1991 $0.0 $0.0 $0.0 $3.7 $388.2 $33.1 $43.6 $830.4 $3.0 $0.0 $25.8 $1,327.9
1990 $0.0 $0.0 $0.0 $3.9 $379.8 $50.0 $44.5 $865.0 $2.8 $0.0 $22.0 $1,368.0

Return to top of page

Nebraska Energy Expenditures
by Fuel Type, Transportation Sector
1970 – 1989

(Million Nominal Dollars)

Year Coal Electricity Natural
Gas
Petroleum Renewable Annual
Total
Aviation
Gasoline
Diesel
Fuel
Jet
Fuel
Lubri­cants Motor
Gasoline
Propane Residual
Fuel
Fuel
Ethanol
1989 $0.0 $0.0 $0.0 $3.9 $328.6 $37.1 $39.7 $762.2 $2.4 $0.0 $21.4 $1,195.2
1988 $0.0 $0.0 $0.0 $3.6 $337.4 $34.2 $37.2 $660.0 $1.9 $0.0 $14.7 $1,088.9
1987 $0.0 $0.0 $0.0 $3.4 $314.5 $32.9 $36.2 $656.7 $1.9 $0.0 $14.3 $1,059.8
1986 $0.0 $0.0 $0.0 $5.0 $270.5 $32.8 $33.8 $628.5 $1.5 $0.0 $11.0 $983.1
1985 $0.0 $0.0 $0.0 $4.9 $261.0 $45.9 $34.9 $822.6 $1.9 $0.0 $13.9 $1,185.2
1984 $0.0 $0.0 $0.0 $5.5 $256.0 $49.3 $37.4 $843.6 $1.5 $0.0 $14.6 $1,207.9
1983 $0.0 $0.0 $0.0 $6.3 $277.2 $53.9 $33.6 $843.0 $4.5 $0.0 $13.2 $1,231.7
1982 $0.0 $0.0 $0.0 $6.8 $234.3 $57.2 $31.8 $952.2 $3.4 $0.0 $7.3 $1,292.9
1981 $0.0 $0.0 $0.0 $11.7 $211.5 $60.9 $36.4 $1,004.8 $4.0 $0.1 $3.1 $1,332.5
1980 $0.0 $0.0 $0.0 $9.7 $210.2 $56.2 $30.3 $923.3 $3.3 $0.0 $0.0 $1,233.0
1979 $0.0 $0.0 $0.0 $5.2 $177.9 $42.3 $24.2 $730.4 $2.2 $0.2 $0.0 $982.3
1978 $0.0 $0.0 $0.0 $4.5 $136.9 $31.9 $17.2 $587.5 $3.1 $0.0 $0.0 $781.1
1977 $0.0 $0.0 $0.0 $3.7 $116.8 $26.2 $14.7 $557.4 $2.6 $0.3 $0.0 $721.6
1976 $0.0 $0.0 $0.0 $2.5 $84.4 $21.1 $14.2 $527.0 $2.7 $0.4 $0.0 $652.3
1975 $0.0 $0.0 $0.0 $2.5 $67.2 $19.3 $13.6 $472.2 $2.1 $1.5 $0.0 $578.3
1974 $0.0 $0.0 $0.0 $2.8 $70.3 $15.8 $14.4 $418.7 $2.2 $1.8 $0.0 $526.1
1973 $0.0 $0.0 $0.0 $2.0 $45.5 $8.5 $11.1 $338.9 $1.1 $0.7 $0.0 $407.9
1972 $0.0 $0.0 $0.0 $1.0 $32.5 $7.4 $11.5 $299.9 $1.0 $0.8 $0.0 $354.1
1971 $0.0 $0.0 $0.0 $2.2 $25.5 $7.8 $10.1 $277.6 $1.1 $0.6 $0.0 $324.9
1970 $0.0 $0.0 $0.0 $2.2 $24.4 $7.3 $9.8 $271.7 $0.9 $0.7 $0.0 $317.0

Return to top of page

Sources: State Energy Price and Expenditure Report. Energy Information Administration, Washington, DC. Nebraska Department of Environment and Energy, Lincoln, NE.

Notes: Totals may not equal the sum of the components due to independent rounding. Denaturant is excluded from fuel ethanol. NA indicates that the data is not available.

The table and graph were updated on January 9, 2024.
Typically, there are one to two years between updates.

Return to top of page