Nebraska Department of Environment and Energy

Air Water Land Energy

Nebraska Energy Statistics

Nebraska's Total Energy Consumption
by End–Use Sector

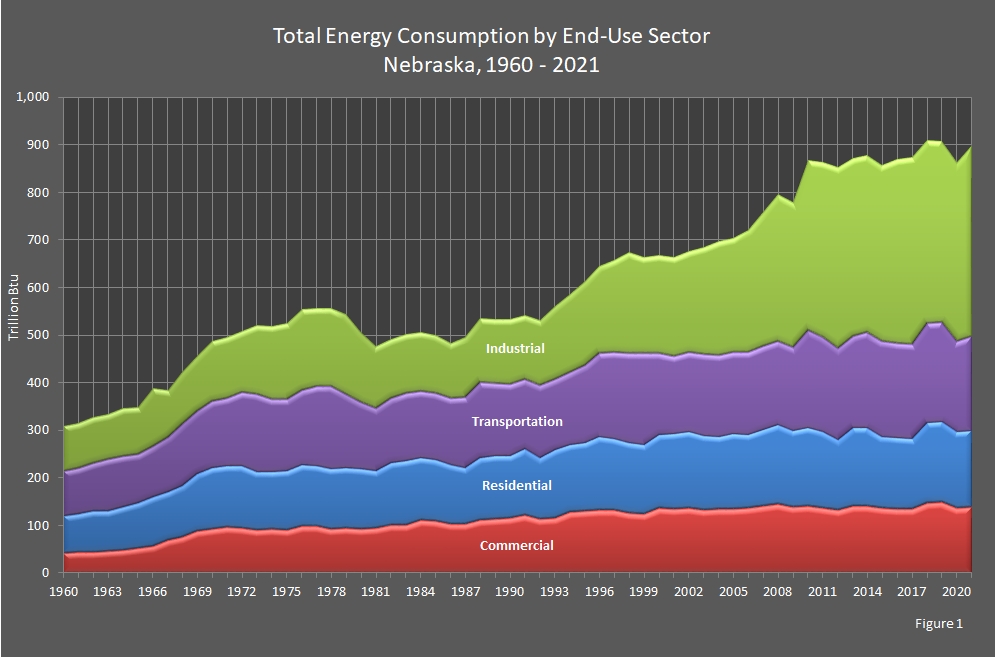
In 2021, the industrial sector consumed nearly half (45 percent) of Nebraska's total energy consumption. The other three end–use sectors comprised relatively equal portions of Nebraska's total energy consumption. Twenty–two (22) percent of the energy consumed in Nebraska was used in the transportation sector. The residential sector consumed 18 percent, and the commercial sector consumed 15 percent. This is reflected in Figure 1.

Between 2020 and 2021, the industrial sector's energy use increased 6.5 percent, the transportation sector's energy use increased 4.8 percent, and the commercial sector's energy use increased 1.2 percent. The residential sector's energy use decreased 0.5 percent.

Return to top of page

chart showing Nebraska's Total Energy Consumption by End-Use Sector

Return to top of page

Total Energy Consumption by
End–Use Sector
Nebraska
2020 – 2021

[Trillion British Thermal Units (Btu)]

Year End–Use Sectors Total
Energy
Consumption
Commercial Industrial Residential Transportation
2021 138.6 400.0 159.3 200.4 898.0
2020 137.0 375.6 160.1 191.3 863.5

Return to top of page

Total Energy Consumption by
End–Use Sector
Nebraska
2000 – 2019

[Trillion British Thermal Units (Btu)]

Year End–Use Sectors Total
Energy
Consumption
Commercial Industrial Residential Transportation
2019 148.3 380.9 169.3 208.8 907.2
2018 147.5 380.3 167.9 207.2 902.8
2017 135.2 392.4 146.2 202.3 876.0
2016 134.5 384.6 148.3 200.9 868.3
2015 137.1 368.1 148.6 200.1 853.8
2014 141.6 363.8 163.5 201.2 870.2
2013 140.4 374.9 163.6 193.8 872.8
2012 131.8 382.1 147.0 192.5 853.4
2011 135.8 368.1 160.4 198.9 863.6
2010 141.1 351.7 163.2 205.0 861.6
2009 138.9 304.6 158.7 176.7 778.8
2008 145.8 308.3 165.2 176.0 795.4
2007 140.6 280.4 159.7 176.3 757.1
2006 133.1 252.8 149.7 174.3 710.1
2005 130.5 237.2 153.3 172.6 693.6
2004 129.7 235.1 147.5 173.7 686.0
2003 127.9 221.3 151.9 172.4 673.5
2002 132.9 209.2 155.4 167.1 664.6
2001 130.4 206.3 154.4 162.4 653.5
2000 132.3 202.8 148.3 172.5 655.9

Return to top of page

Total Energy Consumption by
End–Use Sector
Nebraska
1980 – 1999

[Trillion British Thermal Units (Btu)]

Year End–Use Sectors Total
Energy
Consumption
Commercial Industrial Residential Transportation
1999 120.5 199.3 140.3 194.2 654.2
1998 123.1 208.7 143.3 188.8 664.1
1997 128.6 191.6 146.4 180.9 647.5
1996 129.6 179.8 148.1 178.0 634.4
1995 126.8 173.1 139.7 163.5 603.0
1994 123.5 160.1 137.3 153.9 574.7
1993 111.8 149.5 139.2 150.7 551.2
1992 110.5 133.4 125.4 154.2 523.4
1991 118.7 132.9 134.8 148.3 534.7
1990 112.7 133.6 127.2 151.8 525.3
1989 112.8 135.6 132.2 153.4 533.9
1988 111.5 133.2 129.2 161.2 535.1
1987 102.0 126.3 119.4 148.0 495.7
1986 102.9 114.8 123.3 141.5 482.5
1985 108.4 122.3 128.1 141.1 499.9
1984 112.0 124.2 128.9 141.4 506.5
1983 100.8 123.6 134.1 144.3 502.8
1982 99.9 124.6 132.1 135.5 492.0
1981 94.5 131.9 119.4 131.8 477.6
1980 92.7 147.5 125.9 141.0 507.1

Return to top of page

Total Energy Consumption by
End–Use Sector
Nebraska
1960 – 1979

[Trillion British Thermal Units (Btu)]

Year End–Use Sectors Total
Energy
Consumption
Commercial Industrial Residential Transportation
1979 95.3 169.0 124.7 156.1 545.1
1978 92.2 164.2 127.3 173.0 556.7
1977 98.1 164.6 125.9 168.4 556.9
1976 98.5 170.2 128.0 158.2 554.8
1975 89.6 160.5 125.6 149.9 525.7
1974 92.1 153.5 119.7 153.2 518.5
1973 89.9 146.5 122.3 163.5 522.1
1972 95.1 128.3 130.5 155.6 509.5
1971 96.6 127.7 129.0 142.8 496.2
1970 93.4 127.1 127.7 139.3 487.5
1969 88.8 116.4 118.3 132.4 455.9
1968 76.1 109.2 107.7 129.8 422.8
1967 68.7 98.5 101.6 116.4 385.2
1966 57.1 123.0 101.6 107.7 389.2
1965 52.3 98.5 95.7 102.1 348.6
1964 49.3 101.5 89.2 107.1 347.1
1963 46.4 95.6 84.6 108.3 335.0
1962 45.0 95.3 85.9 101.2 327.4
1961 43.5 94.4 80.6 96.6 314.9
1960 42.1 92.9 78.6 94.2 307.8

Return to top of page

Sources: State Energy Data Report. Energy Information Administration, Washington, DC. Nebraska Department of Environment and Energy, Lincoln, NE.

Note: Totals may not equal the sum of the components due to independent rounding.

The table and graph were updated on January 9, 2024.
Typically, there are one to two years between updates.

Return to top of page