Nebraska Department of Environment and Energy

Air Water Land Energy

Nebraska Energy Statistics

Nebraska's Total Energy Consumption
by Fuel Type

Nebraska's total energy consumption in 2021 was 898 trillion British thermal units (Btu), which was a 4.0 percent increase from 2020. Total energy consumption is consumption of primary resources and end–use energy. According to the Energy Consumption Comparison by State report, Nebraska had the 19th lowest energy consumption in the country, which was less than one percent (0.9 percent) of the nation's total consumption. Using energy consumption per capita for comparison, Nebraska was the 9th highest in the country.

Primary resource consumption includes energy used in the generation of electricity whether that electricity is used in Nebraska or not. In 2021, consumption of primary energy resources was 934.12 trillion Btu, which was a 3.5–percent increase from 2020.

End–use energy consumption refers to the energy content of electricity and other fuels at the point of use by consumers. Unless otherwise noted, total energy consumption refers to total primary energy consumption adjusted for net interstate sales of electricity. Net interstate sales represent the difference between the energy in electricity sold, including the associated losses, and the energy input at electric utilities in Nebraska. Net interstate sales will be a negative number if Nebraska sold, or exported, electricity; and net interstate sales will be a positive number if Nebraska had to buy, or import, electricity. A percentage of the primary energy used to generate and distribute electricity is lost as waste heat. This loss is referred to as associated energy losses or electric system losses.

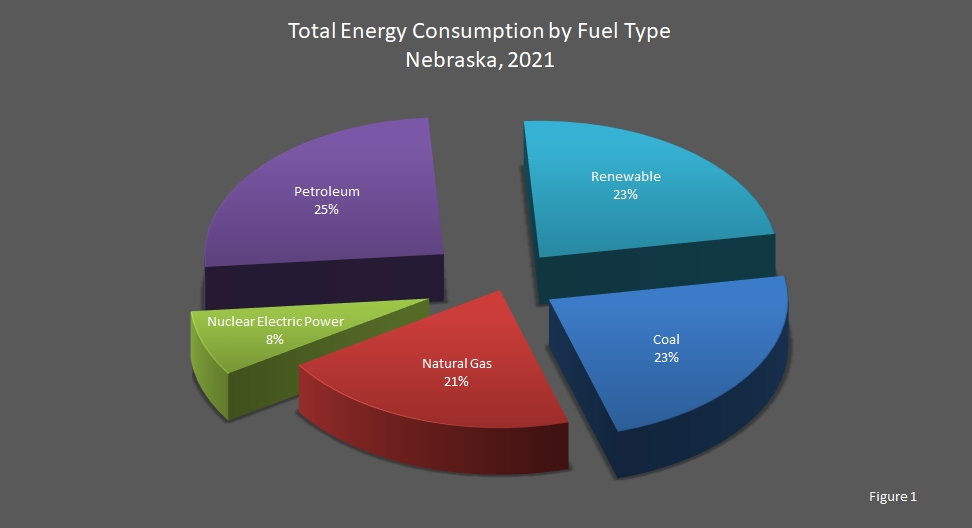
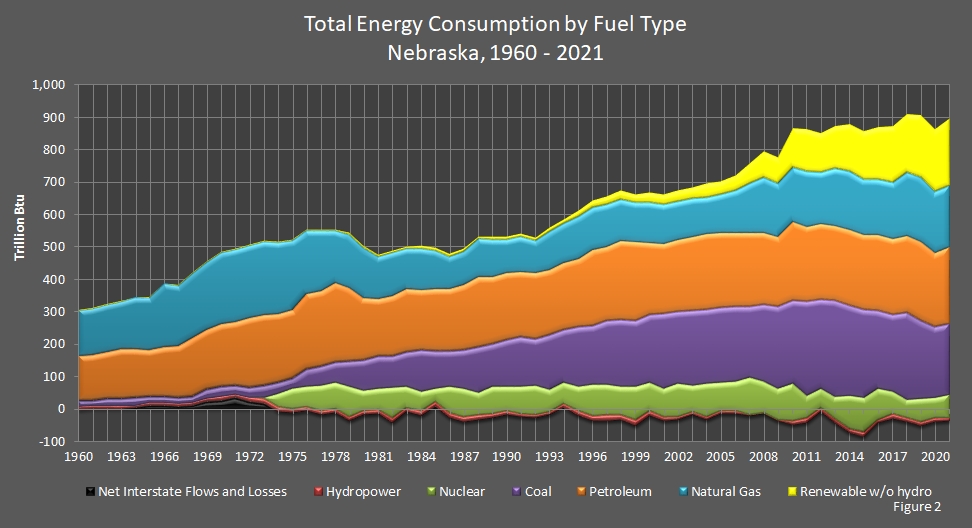
In 2021, Nebraska's energy needs were met by petroleum (25 percent), coal (23 percent), natural gas (21 percent), renewable energy (23 percent), and nuclear electric power (8 percent). See Figure 1 just below. In Figure 2 farther below, hydroelectric power is broken out of renewable energy. (To see a pie chart of electricity generation fuels, go to the Annual Electricity Generation by Fuel Type report.)

From 2020 to 2021, nuclear electric power use increased 11.2 percent, renewable energy use increased 7.2 percent, petroleum use increased 4.1 percent, and coal use increased 1.2 percent. Natural gas use decreased 0.9 percent.

Return to top of page

pie chart showing Energy Consumption by Fuel Type in Nebraska.

Return to top of page

Petroleum products are listed in the second table below. Petroleum is divided into ten fuels or categories of fuels: distillate fuel (47.9 percent of petroleum), motor gasoline (42.3 percent), propane (4.17 percent), asphalt and road oil (2.60 percent), jet fuel (2.55 percent), other petroleum (0.98 percent), lubricants (0.74 percent), aviation gasoline (0.07 percent), residual fuel (0.01 percent), and kerosene (0.003 percent).

Other petroleum products include sixteen (16) separate products, all of which are assigned to the industrial sector. The sixteen products are:

  1. aviation gasoline blending components;
  2. crude oil;
  3. motor gasoline blending components;
  4. natural gasoline, including isopentane;
  5. pentanes plus;
  6. petrochemical feedstocks, naphtha;
  7. petrochemical feedstocks, other oils;
  8. petrochemical feedstocks, still gas;
  9. petroleum coke;
  10. plant condensate;
  11. special naphthas;
  12. still gas;
  13. unfinished oils;
  14. unfractionated streams;
  15. waxes; and
  16. miscellaneous.
    • Miscellaneous products vary from inexpensive (absorption oils similar to kerosene) to very expensive (hydraulic fluids) products. The greater part of the miscellaneous product line consists of finished petrochemicals, especially the aromatic hydrocarbons: benzene, toluene, and the xylenes.

Renewable energy components are listed in the third table below. Renewable energy consists of biofuels (53.27 percent of renewable energy), wind (39.02 percent of renewable energy), conventional hydroelectric power (4.57 percent of renewable energy), wood and waste (2.22 percent of renewable energy), geothermal (0.56 percent of renewable energy), and photovoltaic and solar thermal energy (0.36 percent of renewable energy). Note that Nebraska did use wind energy in 1998, 1999, and 2000 although the numbers were not large enough until 2001 to be included in the table below. Also see Nebraska's renewable energy consumption report.

Return to top of page

chart showing Energy Consumption by Fuel Type in Nebraska.

Return to top of page

Energy Consumption by Fuel Type, Nebraska,
1960 – 2021

[Trillion British Thermal Units (Btu)]

Year Primary Energy Resources Total
Primary
Energy
Consumption
Net
Interstate
Flow of
Electricity / Losses
Total
Energy
Consumption
Fossil Fuels Nuclear
Electric
Power
Renewable
Energy
Coal Natural Gas Petro­leum
2021 216.30 191.01 237.54 71.88 217.40 934.12 –36.16 897.96
2020 213.75 192.73 228.18 64.65 202.86 902.15 –38.66 863.49
2019 240.41 198.77 243.81 72.59 203.93 959.51 –52.29 907.22
2018 264.07 196.45 237.53 58.88 186.63 943.33 –40.55 902.78
2017 233.81 175.57 238.20 72.30 185.61 905.38 –29.35 876.03
2016 240.47 172.93 238.34 97.80 161.80 911.22 –42.91 868.31
2015 266.54 170.33 236.14 107.98 158.49 939.14 –86.02 853.12
2014 276.54 179.71 236.48 105.66 144.92 943.19 –73.97 869.22
2013 292.96 179.62 234.16 71.74 136.36 914.73 –42.17 872.56
2012 272.59 161.77 233.70 60.80 132.64 861.39 –8.41 852.97
2011 285.38 173.66 231.48 72.55 143.85 906.81 –44.19 862.61
2010 254.55 169.61 242.17 115.54 128.10 909.86 –49.16 860.71
2009 249.59 165.42 217.33 98.68 86.31 817.27 –37.91 779.35
2008 234.65 172.86 220.09 99.08 84.20 810.80 –14.93 795.87
2007 216.87 153.49 229.65 115.82 63.47 779.28 –21.78 757.51
2006 227.44 131.42 229.15 93.94 54.71 736.64 –26.30 710.34
2005 228.67 120.13 229.08 91.86 51.54 721.23 –27.30 693.92
2004 223.62 116.01 233.90 106.80 52.12 732.40 –46.06 686.34
2003 227.29 119.74 229.45 83.34 45.55 705.36 –31.50 673.86
2002 217.94 121.17 222.77 105.70 44.21 711.77 –46.62 665.15
2001 226.69 124.05 215.92 91.13 43.41 701.18 –47.28 653.90
2000 206.94 127.26 222.07 89.99 43.71 689.94 –33.60 656.34
1999 198.49 121.36 246.44 105.45 44.63 716.22 –61.65 654.57
1998 204.80 131.11 244.15 86.64 42.68 709.20 –44.77 664.43
1997 193.33 132.01 230.86 97.27 41.95 695.40 –47.50 647.90
1996 178.88 133.53 232.57 99.33 38.44 682.73 –47.98 634.75
1995 179.48 133.68 210.14 78.65 33.40 635.33 –31.86 603.47
1994 160.51 123.98 207.03 66.32 24.73 582.56 –7.35 575.22
1993 166.21 122.21 199.53 71.48 20.86 580.28 –28.66 551.63
1992 140.93 103.22 203.50 91.61 21.14 560.40 –36.80 523.60
1991 152.01 111.96 200.71 84.37 19.44 568.48 –33.57 534.91
1990 142.02 106.85 205.22 79.49 19.71 553.29 –27.78 525.50
1989 131.10 116.61 206.91 85.48 22.07 562.16 –28.04 534.12
1988 139.34 117.99 215.97 72.39 22.97 568.66 –33.34 535.32
1987 116.46 105.57 200.72 89.68 24.83 537.27 –41.37 495.70
1986 109.94 101.87 191.87 81.01 26.65 511.33 –28.66 482.67
1985 115.48 121.22 189.43 43.91 24.63 494.67 5.40 500.08
1984 124.26 129.49 187.56 62.68 22.85 526.83 –20.23 506.60
1983 104.82 124.99 195.88 66.32 21.52 513.53 –10.40 503.13
1982 96.75 135.55 185.02 96.92 19.74 533.97 –41.60 492.37
1981 98.58 133.48 176.57 66.05 18.11 492.79 –14.93 477.87
1980 93.94 159.48 189.77 63.08 19.78 526.05 –18.71 507.35
1979 77.60 168.96 224.93 94.20 16.83 582.52 –37.11 545.41
1978 59.81 162.69 246.65 84.52 16.10 569.77 –12.89 556.88
1977 59.34 188.43 231.48 80.25 16.14 575.63 –18.47 557.16
1976 53.71 197.44 229.82 64.34 16.38 561.68 –6.59 555.10
1975 32.89 217.52 208.45 65.15 15.40 539.41 –13.57 525.84
1974 32.76 223.25 210.20 44.60 16.16 526.98 –8.30 518.67
1973 36.87 230.78 214.26 6.54 16.91 505.36 16.87 522.23
1972 33.51 226.36 211.55 0.00 16.82 488.24 21.36 509.60
1971 26.32 225.46 195.54 0.00 15.85 463.17 33.05 496.22
1970 29.72 224.11 192.29 0.00 15.95 462.07 25.46 487.53
1969 27.08 209.61 182.83 0.00 14.53 434.06 21.90 455.96
1968 17.19 202.94 177.88 0.00 14.71 412.73 10.04 422.77
1967 18.30 187.91 158.87 0.00 13.88 378.95 6.28 385.24
1966 19.75 195.86 151.51 0.00 13.96 381.08 8.24 389.32
1965 20.82 164.72 140.64 –0.06 13.56 339.67 9.04 348.72
1964 23.65 160.55 147.26 1.08 12.80 345.34 1.86 347.20
1963 24.51 145.77 151.33 0.89 13.20 335.70 –0.57 335.13
1962 23.05 149.32 141.55 0.00 12.97 326.89 0.63 327.53
1961 18.16 144.57 138.50 0.00 12.83 314.06 1.01 315.07
1960 20.01 140.43 136.16 0.00 13.43 310.02 –2.03 307.99

Return to top of page

Petroleum Products Consumption, Nebraska,
1960 – 2021

[Trillion British Thermal Units (Btu)]

Year Primary Energy Resources
Petroleum
Asphalt and Road Oil Aviation Gasoline Distillate Fuel Jet Fuel Kero­sene Lubri­cants Motor Gasoline Other Petroleum 1 Propane Residual Fuel
2021 6.18 0.18 113.69 6.06 0.01 1.76 100.37 2.34 9.89 0.02
2020 6.25 0.18 113.56 4.92 0.01 1.65 93.77 0.88 10.34 0.02
2019 5.12 0.19 117.75 6.57 0.01 1.76 102.44 0.94 11.34 0.02
2018 5.70 0.19 114.83 4.54 0.01 1.78 102.39 1.03 9.86 0.04
2017 6.47 0.20 111.37 7.92 0.01 1.80 101.60 0.64 8.19 0.01
2016 5.80 0.18 111.20 7.52 0.01 1.96 102.15 0.63 8.88 0.00
2015 6.33 0.17 111.75 6.48 0.01 2.03 99.98 0.63 8.77 0.00
2014 6.17 0.19 110.52 6.12 0.01 1.87 100.62 0.62 10.35 0.01
2013 6.12 0.17 110.02 6.07 0.01 1.79 97.10 0.60 12.28 0.00
2012 7.56 0.22 114.45 5.11 0.01 1.69 94.69 0.21 9.76 0.01
2011 6.75 0.23 112.51 4.68 0.01 1.84 94.35 0.21 10.88 0.01
2010 7.57 0.25 117.56 4.68 0.03 1.94 97.81 0.22 12.11 0.01
2009 7.27 0.32 93.30 3.95 0.04 1.74 96.70 0.19 13.77 0.05
2008 5.38 0.33 94.64 5.04 0.02 1.94 98.86 0.22 13.14 0.51
2007 6.00 0.40 99.73 5.49 0.05 2.09 102.15 0.22 13.09 0.44
2006 6.99 0.41 95.95 6.01 0.05 2.02 103.18 0.25 13.82 0.49
2005 8.07 0.42 94.83 5.30 0.10 2.08 103.22 0.20 13.96 0.91
2004 8.64 0.28 95.62 5.21 0.12 2.09 105.40 0.20 14.89 1.45
2003 8.87 0.41 89.65 6.83 0.09 2.06 104.41 0.21 16.03 0.89
2002 5.33 0.47 81.09 8.66 0.04 2.23 105.74 0.22 18.21 0.78
2001 5.68 0.44 82.67 6.31 0.12 2.26 104.03 0.23 13.38 0.80
2000 6.22 0.32 86.92 6.98 0.09 2.46 103.91 0.11 14.17 0.90
1999 12.39 0.36 103.31 8.87 0.06 2.50 104.76 0.12 13.60 0.48
1998 9.29 0.32 108.50 6.13 0.13 2.47 104.14 0.14 12.29 0.73
1997 9.62 0.45 98.06 6.10 0.13 2.36 101.73 0.14 11.57 0.69
1996 11.76 0.38 96.87 5.71 0.11 2.24 100.16 0.16 14.14 1.05
1995 6.16 0.39 84.97 5.67 0.10 2.31 98.47 0.17 11.16 0.76
1994 6.84 0.38 84.94 7.03 0.12 2.35 92.50 0.17 11.38 1.33
1993 5.29 0.36 80.66 6.42 0.14 2.24 91.53 0.17 10.99 1.73
1992 5.96 0.41 80.66 6.62 0.11 2.20 94.30 0.16 11.92 1.16
1991 9.41 0.43 75.43 6.60 0.10 2.16 93.51 0.15 11.68 1.25
1990 9.21 0.42 74.84 8.29 0.23 2.42 96.92 0.56 10.71 1.61
1989 7.50 0.47 75.11 8.16 0.12 2.35 96.80 0.58 13.48 2.35
1988 8.38 0.48 82.26 8.25 0.43 2.29 97.75 0.59 12.95 2.59
1987 8.24 0.45 73.43 7.51 0.59 2.37 93.95 0.55 11.96 1.67
1986 6.33 0.59 70.04 7.40 0.95 2.10 93.28 0.52 9.06 1.58
1985 3.14 0.49 72.29 7.42 0.42 2.15 93.17 0.42 9.54 0.39
1984 4.19 0.54 69.92 7.59 0.50 2.30 93.88 0.41 7.79 0.44
1983 4.43 0.60 67.26 8.14 0.43 2.16 94.06 0.41 17.73 0.66
1982 4.89 0.62 53.90 7.95 0.53 2.06 95.93 0.38 17.57 1.20
1981 4.45 1.08 47.77 8.01 0.49 2.26 96.30 0.88 14.88 0.44
1980 4.77 1.08 53.29 8.69 0.35 2.36 100.33 0.76 16.72 1.43
1979 5.42 0.91 74.92 10.50 0.32 2.65 107.57 0.78 17.41 4.44
1978 10.66 1.04 73.57 10.99 2.59 2.53 115.96 0.85 20.50 7.96
1977 7.29 0.93 63.59 9.76 3.17 2.36 114.57 0.86 22.13 6.84
1976 3.79 0.70 60.73 9.33 3.60 3.32 113.36 0.90 24.63 9.46
1975 5.00 0.71 49.56 9.24 3.14 2.98 108.40 0.88 21.67 6.87
1974 6.47 0.88 51.54 9.89 3.53 3.15 107.23 0.88 20.05 6.60
1973 5.87 0.87 54.21 9.15 4.43 3.29 110.04 0.91 21.28 4.21
1972 5.90 0.45 52.99 9.44 4.37 2.89 107.23 0.85 22.90 4.53
1971 7.37 1.00 44.34 9.93 3.86 2.70 101.02 0.81 20.88 3.64
1970 7.55 1.00 43.39 9.77 3.30 2.91 97.31 0.62 21.46 4.99
1969 4.92 1.18 37.51 11.16 2.98 2.85 94.99 0.66 21.70 4.90
1968 5.23 2.81 37.60 11.58 3.62 2.83 91.67 0.48 18.03 4.04
1967 4.02 1.68 30.13 10.07 1.97 2.58 88.06 0.32 16.35 3.69
1966 4.74 1.83 26.00 8.19 4.10 2.68 86.21 0.26 14.81 2.70
1965 4.35 2.07 21.49 7.41 4.48 2.58 82.71 0.30 13.17 2.09
1964 4.34 2.24 27.14 8.24 2.81 2.43 81.01 0.27 12.61 6.18
1963 5.60 2.16 25.34 8.03 2.59 2.31 83.49 0.28 14.24 7.30
1962 4.68 2.13 23.77 7.88 3.46 2.32 81.35 0.36 11.43 4.18
1961 4.66 2.10 25.99 7.04 3.53 2.51 78.61 0.36 10.59 3.12
1960 5.18 1.87 24.18 6.44 3.84 2.58 78.79 0.37 10.31 2.61

Return to top of page

Renewable Energy Consumption, Nebraska,
1960 – 2021

[Trillion British Thermal Units (Btu)]

Year Primary Energy Resources
Renewable Energy
Geo­thermal Hydro­electric
Power
Photo­voltaic and
Solar Thermal
Wind Biomass
Biofuels Wood and Waste
2021 1.21 9.93 0.79 84.83 115.80 4.83
2020 1.21 12.19 0.68 79.91 104.15 4.72
2019 1.21 11.94 0.45 64.22 120.62 5.50
2018 1.21 12.58 0.37 50.52 120.70 5.20
2017 1.21 13.72 0.22 46.84 119.53 3.97
2016 1.21 7.91 0.09 35.07 112.89 4.52
2015 1.21 15.70 0.04 29.64 107.82 4.16
2014 1.21 11.01 0.04 26.03 101.93 4.59
2013 1.21 10.72 0.04 17.19 102.58 4.52
2012 1.21 11.96 0.03 12.22 103.53 3.58
2011 1.20 15.71 0.03 10.21 112.78 3.81
2010 1.15 12.82 0.03 4.11 102.22 7.66
2009 1.02 4.23 0.03 3.74 69.44 7.79
2008 0.88 3.41 0.03 2.11 70.35 7.36
2007 0.80 3.43 0.02 2.14 49.89 7.14
2006 0.73 8.86 0.02 2.59 36.10 6.37
2005 0.67 8.71 0.02 0.97 33.10 8.04
2004 0.58 9.15 0.01 0.39 33.39 8.58
2003 0.51 9.92 0.01 0.39 26.06 8.63
2002 0.38 11.17 0.01 0.08 24.31 8.24
2001 0.35 11.62 0.01 0.03 23.73 7.65
2000 0.32 15.31 0.01 0.00 22.38 5.66
1999 0.32 17.58 0.01 0.00 20.76 5.94
1998 0.31 17.16 0.02 0.00 19.38 5.80
1997 0.25 17.08 0.02 0.00 18.27 6.32
1996 0.22 16.56 0.02 0.00 13.85 7.77
1995 0.18 14.71 0.02 0.00 14.30 4.18
1994 0.16 13.53 0.02 0.00 6.91 4.10
1993 0.15 10.33 0.01 0.00 6.11 4.27
1992 0.12 11.12 0.01 0.00 4.92 4.97
1991 0.10 10.90 0.01 0.00 3.75 4.67
1990 0.08 11.86 0.01 0.00 3.30 4.46
1989 0.06 12.08 0.01 0.00 3.52 6.40
1988 0.00 13.94 0.00 0.00 2.96 6.06
1987 0.00 16.33 0.00 0.00 2.83 5.68
1986 0.00 17.53 0.00 0.00 2.34 6.77
1985 0.00 15.05 0.00 0.00 2.16 7.42
1984 0.00 14.04 0.00 0.00 1.62 7.20
1983 0.00 14.16 0.00 0.00 1.48 5.88
1982 0.00 12.67 0.00 0.00 0.74 6.33
1981 0.00 12.51 0.00 0.00 0.30 5.30
1980 0.00 13.88 0.00 0.00 0.00 5.90
1979 0.00 12.90 0.00 0.00 0.00 3.93
1978 0.00 12.30 0.00 0.00 0.00 3.79
1977 0.00 12.74 0.00 0.00 0.00 3.40
1976 0.00 13.24 0.00 0.00 0.00 3.14
1975 0.00 12.62 0.00 0.00 0.00 2.78
1974 0.00 13.51 0.00 0.00 0.00 2.65
1973 0.00 14.24 0.00 0.00 0.00 2.67
1972 0.00 14.24 0.00 0.00 0.00 2.58
1971 0.00 14.24 0.00 0.00 0.00 1.60
1970 0.00 14.38 0.00 0.00 0.00 1.57
1969 0.00 12.93 0.00 0.00 0.00 1.60
1968 0.00 13.04 0.00 0.00 0.00 1.67
1967 0.00 12.14 0.00 0.00 0.00 1.74
1966 0.00 12.11 0.00 0.00 0.00 1.85
1965 0.00 11.66 0.00 0.00 0.00 1.90
1964 0.00 10.49 0.00 0.00 0.00 2.31
1963 0.00 10.63 0.00 0.00 0.00 2.57
1962 0.00 10.30 0.00 0.00 0.00 2.68
1961 0.00 9.88 0.00 0.00 0.00 2.95
1960 0.00 10.32 0.00 0.00 0.00 3.11

Return to top of page

Sources: State Energy Data Report. Energy Information Administration, Washington, DC. Nebraska Department of Environment and Energy, Lincoln, NE.

Notes: Totals may not equal the sum of the components due to independent rounding. NA = Not Available. (s) = Btu value less than 0.05.

1 Other petroleum includes the subtotal of sixteen (16) petroleum products consumed in the industrial sector.

The tables and graphs were updated on January 9, 2024.
Typically, there are one to two years between updates.

Return to top of page