Analysis
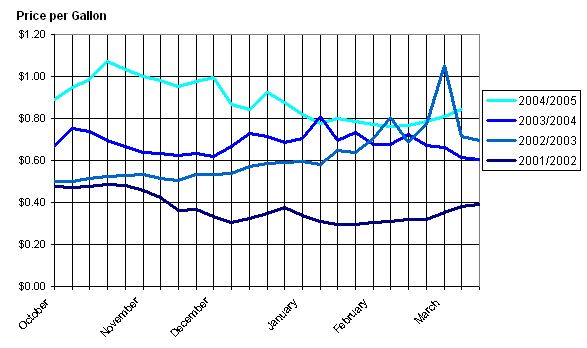
The average wholesale propane price on March 7, 2005, increased 3 cents from last week to 84 cents per gallon (see the table at the end of this report). The graph below shows the spread in Nebraska prices from month to month and from this year compared to previous years. The price was 18 cents (28 percent) higher than the price was at this time last year. Other states in the Midwest region had comparable wholesale prices ranging from 77 to 90 cents per gallon with the region averaging 86 cents. States adjacent to Nebraska, such as Kansas, South Dakota, Iowa, and Missouri, had prices of 86, 86, 86, and 85 cents, respectively. With 10.3 million barrels, the Midwest region inventory level was in the normal range for this time of year.
Note: The annual report for the 2003-2004 winter season is available.
Heating Season
The Oil Price Information Service collects wholesale propane prices each week for Nebraska and eleven (11) other states in the Midwest Region during the heating season (October to March). The Energy Information Administration, the independent statistical and analytical agency within the U.S. Department of Energy, uses the prices collected by the Oil Price Information Service to calculate a state average price, a regional average price, and a national average price which can be seen in the report Wholesale Propane Prices by Region and State.
Off Season
Prices are not collected during the off season (April through September).
Midwest Region
For statistical purposes, the Energy Information Administration defines the Midwest region to include the states of Iowa, Illinois, Indiana, Kansas, Kentucky, Michigan, Minnesota, Missouri, Nebraska, North Dakota, Ohio, Oklahoma, South Dakota, Tennessee, and Wisconsin.