official nebraska government website

Motor Vehicle Miles Traveled in Nebraska

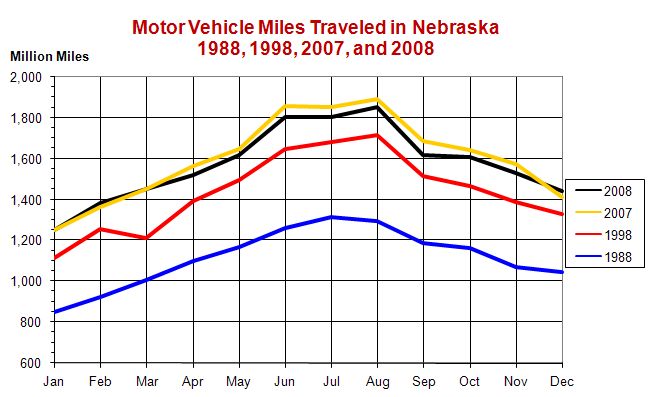
The graph shows monthly travel in 2008, the previous year, ten years prior, and twenty years prior.  Using the table beneath the graph, total travel in 2008 decreased 1.8 percent from 2007.  This is the second consecutive year to have a drop in miles traveled.  A decrease from a prior year had not occurred since the early 1980s.  Total travel in 2008 increased 9.6 percent from ten years prior (1998) and increased 41.1 percent from twenty years prior (1988).  Travel increased 28.8 percent from 1988 to 1998.

Note:  An archive is available.

Motor Vehicle Miles Traveled in Nebraska
1979 - 2008

(Million Miles)

Year Jan Feb Mar Apr May Jun Jul Aug Sep Oct Nov Dec Annual
Total
1979 688 794 897 981 1,036 1,091 1,117 1,133 1,041 1,001 881 869 11,529
1980 729 741 807 899 989 1,065 1,120 1,126 1,006 982 921 837 11,222
1981 775 770 865 949 1,022 1,101 1,136 1,143 1,030 987 902 832 11,512
1982 677 783 851 934 1,008 1,101 1,153 1,138 1,038 1,001 918 834 11,436
1983 754 768 843 929 1,035 1,129 1,181 1,162 1,066 1,018 885 764 11,534
1984 778 811 857 946 1,071 1,158 1,190 1,186 1,077 1,032 975 853 11,934
1985 763 816 932 982 1,085 1,154 1,199 1,194 1,052 1,062 936 879 12,054
1986 839 834 971 1,001 1,109 1,187 1,239 1,248 1,117 1,095 1,019 971 12,630
1987 868 916 908 1,082 1,151 1,228 1,295 1,276 1,173 1,145 1,055 994 13,091
1988 850 925 1,005 1,097 1,167 1,258 1,314 1,293 1,186 1,165 1,068 1,043 13,371
1989 939 919 1,021 1,147 1,211 1,295 1,320 1,341 1,231 1,206 1,126 1,025 13,781
1990 941 980 1,045 1,154 1,236 1,328 1,363 1,377 1,219 1,199 1,105 1,010 13,957
1991 913 1,012 1,061 1,145 1,244 1,354 1,390 1,397 1,254 1,202 1,040 1,083 14,095
1992 974 1,044 1,097 1,174 1,272 1,372 1,433 1,426 1,291 1,270 1,139 1,082 14,574
1993 939 985 1,106 1,207 1,286 1,411 1,444 1,474 1,318 1,291 1,172 1,144 14,777
1994 984 1,064 1,204 1,243 1,341 1,457 1,521 1,527 1,372 1,340 1,240 1,171 15,464
1995 1,041 1,139 1,172 1,245 1,341 1,519 1,549 1,578 1,411 1,351 1,259 1,204 15,809
1996 1,027 1,185 1,212 1,296 1,380 1,557 1,571 1,612 1,425 1,403 1,286 1,240 16,194
1997 1,085 1,201 1,296 1,303 1,448 1,621 1,633 1,681 1,467 1,413 1,363 1,280 16,791
1998 1,116 1,259 1,212 1,395 1,497 1,646 1,679 1,714 1,517 1,468 1,386 1,330 17,219
1999 1,130 1,259 1,316 1,404 1,502 1,690 1,702 1,753 1,537 1,497 1,433 1,347 17,570
2000 1,191 1,297 1,375 1,435 1,527 1,703 1,710 1,769 1,564 1,487 1,391 1,274 17,723
2001 1,154 1,211 1,361 1,456 1,521 1,722 1,744 1,804 1,585 1,539 1,460 1,383 17,940
2002 1,220 1,338 1,352 1,482 1,583 1,783 1,782 1,827 1,611 1,533 1,469 1,424 18,404
2003 1,227 1,313 1,382 1,484 1,592 1,803 1,812 1,853 1,633 1,597 1,480 1,416 18,592
2004 1,216 1,312 1,427 1,550 1,598 1,801 1,821 1,866 1,659 1,596 1,504 1,462 18,812
2005 1,210 1,398 1,456 1,546 1,643 1,854 1,867 1,859 1,625 1,577 1,481 1,422 18,938
2006 1,306 1,423 1,412 1,569 1,640 1,865 1,839 1,846 1,666 1,629 1,558 1,470 19,223
2007 1,251 1,363 1,453 1,564 1,646 1,857 1,854 1,893 1,688 1,642 1,576 1,415 19,202
2008 1,251 1,381 1,450 1,521 1,615 1,801 1,802 1,851 1,618 1,606 1,528 1,440 18,864

Sources: "State of Nebraska Automatic Traffic Recorder Data."  Nebraska Department of Roads, Lincoln, NE.  Nebraska Energy Office, Lincoln, NE.

Notes: Travel was affected by winter weather in the following months:  January of 1996, 2001, 2004, 2005, and 2007; February of 1994, 2001, 2003, 2004, and 2007; March of 1995, 1998, 2002, and 2006; October of 1997; November of 2000, 2003, 2004, and 2005; and December of 2000, 2003, 2005, 2006, 2007, and 2008.  NA = Not Available.  Numbers in red have been revised.

The table and graph were completed on February 23, 2009.