
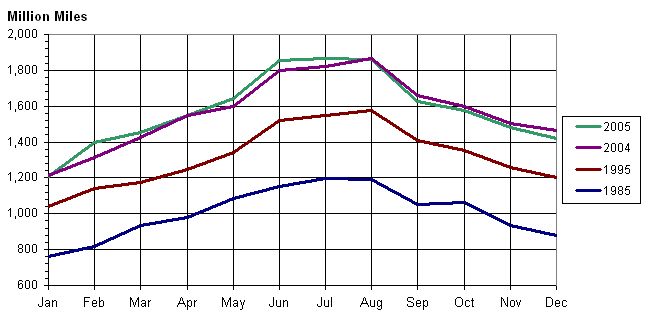
The graph shows monthly travel in 2005, the previous year, ten years prior, and twenty years prior. Using the table beneath the graph, total travel in 2005 increased 1.7 percent from 2004, 19.8 percent from ten years prior (1995), and 57.1 percent from twenty years prior (1985). Travel increased 31.2 percent from 1985 to 1995.
Note: An archive is available.
Motor Vehicle Miles Traveled in Nebraska
1985, 1995, 2004, and 2005
| Year | Jan | Feb | Mar | Apr | May | Jun | Jul | Aug | Sep | Oct | Nov | Dec | Annual Total |
|---|---|---|---|---|---|---|---|---|---|---|---|---|---|
| 1979 | 688 | 794 | 897 | 981 | 1,036 | 1,091 | 1,117 | 1,133 | 1,041 | 1,001 | 881 | 869 | 11,529 |
| 1980 | 729 | 741 | 807 | 899 | 989 | 1,065 | 1,120 | 1,126 | 1,006 | 982 | 921 | 837 | 11,222 |
| 1981 | 775 | 770 | 865 | 949 | 1,022 | 1,101 | 1,136 | 1,143 | 1,030 | 987 | 902 | 832 | 11,512 |
| 1982 | 677 | 783 | 851 | 934 | 1,008 | 1,101 | 1,153 | 1,138 | 1,038 | 1,001 | 918 | 834 | 11,436 |
| 1983 | 754 | 768 | 843 | 929 | 1,035 | 1,129 | 1,181 | 1,162 | 1,066 | 1,018 | 885 | 764 | 11,534 |
| 1984 | 778 | 811 | 857 | 946 | 1,071 | 1,158 | 1,190 | 1,186 | 1,077 | 1,032 | 975 | 853 | 11,934 |
| 1985 | 763 | 816 | 932 | 982 | 1,085 | 1,154 | 1,199 | 1,194 | 1,052 | 1,062 | 936 | 879 | 12,054 |
| 1986 | 839 | 834 | 971 | 1,001 | 1,109 | 1,187 | 1,239 | 1,248 | 1,117 | 1,095 | 1,019 | 971 | 12,630 |
| 1987 | 868 | 916 | 908 | 1,082 | 1,151 | 1,228 | 1,295 | 1,276 | 1,173 | 1,145 | 1,055 | 994 | 13,091 |
| 1988 | 850 | 925 | 1,005 | 1,097 | 1,167 | 1,258 | 1,314 | 1,293 | 1,186 | 1,165 | 1,068 | 1,043 | 13,371 |
| 1989 | 939 | 919 | 1,021 | 1,147 | 1,211 | 1,295 | 1,320 | 1,341 | 1,231 | 1,206 | 1,126 | 1,025 | 13,781 |
| 1990 | 941 | 980 | 1,045 | 1,154 | 1,236 | 1,328 | 1,363 | 1,377 | 1,219 | 1,199 | 1,105 | 1,010 | 13,957 |
| 1991 | 913 | 1,012 | 1,061 | 1,145 | 1,244 | 1,354 | 1,390 | 1,397 | 1,254 | 1,202 | 1,040 | 1,083 | 14,095 |
| 1992 | 974 | 1,044 | 1,097 | 1,174 | 1,272 | 1,372 | 1,433 | 1,426 | 1,291 | 1,270 | 1,139 | 1,082 | 14,574 |
| 1993 | 939 | 985 | 1,106 | 1,207 | 1,286 | 1,411 | 1,444 | 1,474 | 1,318 | 1,291 | 1,172 | 1,144 | 14,777 |
| 1994 | 984 | 1,064 | 1,204 | 1,243 | 1,341 | 1,457 | 1,521 | 1,527 | 1,372 | 1,340 | 1,240 | 1,171 | 15,464 |
| 1995 | 1,041 | 1,139 | 1,172 | 1,245 | 1,341 | 1,519 | 1,549 | 1,578 | 1,411 | 1,351 | 1,259 | 1,204 | 15,809 |
| 1996 | 1,027 | 1,185 | 1,212 | 1,296 | 1,380 | 1,557 | 1,571 | 1,612 | 1,425 | 1,403 | 1,286 | 1,240 | 16,194 |
| 1997 | 1,085 | 1,201 | 1,296 | 1,303 | 1,448 | 1,621 | 1,633 | 1,681 | 1,467 | 1,413 | 1,363 | 1,280 | 16,791 |
| 1998 | 1,116 | 1,259 | 1,212 | 1,395 | 1,497 | 1,646 | 1,679 | 1,714 | 1,517 | 1,468 | 1,386 | 1,330 | 17,219 |
| 1999 | 1,130 | 1,259 | 1,316 | 1,404 | 1,502 | 1,690 | 1,702 | 1,753 | 1,537 | 1,497 | 1,433 | 1,347 | 17,570 |
| 2000 | 1,191 | 1,297 | 1,375 | 1,435 | 1,527 | 1,703 | 1,710 | 1,769 | 1,564 | 1,487 | 1,391 | 1,274 | 17,723 |
| 2001 | 1,154 | 1,211 | 1,361 | 1,456 | 1,521 | 1,722 | 1,744 | 1,804 | 1,585 | 1,539 | 1,460 | 1,383 | 17,940 |
| 2002 | 1,220 | 1,338 | 1,352 | 1,482 | 1,583 | 1,783 | 1,782 | 1,827 | 1,611 | 1,533 | 1,469 | 1,424 | 18,404 |
| 2003 | 1,227 | 1,313 | 1,382 | 1,484 | 1,592 | 1,803 | 1,812 | 1,853 | 1,633 | 1,597 | 1,480 | 1,416 | 18,592 |
| 2004 | 1,204 | 1,299 | 1,413 | 1,535 | 1,583 | 1,784 | 1,803 | 1,848 | 1,643 | 1,581 | 1,489 | 1,448 | 18,630 |
| 2005 | 1,210 | 1,398 | 1,456 | 1,546 | 1,643 | 1,854 | 1,867 | 1,859 | 1,625 | 1,577 | 1,481 | 1,422 | 18,938 |
Sources: "State of Nebraska Automatic Traffic Recorder Data." Nebraska Department of Roads, Office of Planning and Administration, Transportation Planning Division, Lincoln, NE. Nebraska Energy Office, Lincoln, NE.
Notes: Travel was affected by winter weather in the following months: January of 1996, 2001, 2004, and 2005; February of 1994, 2001, 2003, and 2004; March of 1995, 1998, and 2002; October of 1997; November of 2000, 2003, 2004, and 2005; and December of 2000, 2003, and 2005. NA = Not Available. Numbers in red are new or revised.
The table and graph were completed on February 16, 2006.