official nebraska government website

Henry Hub Natural Gas Spot Prices 2005

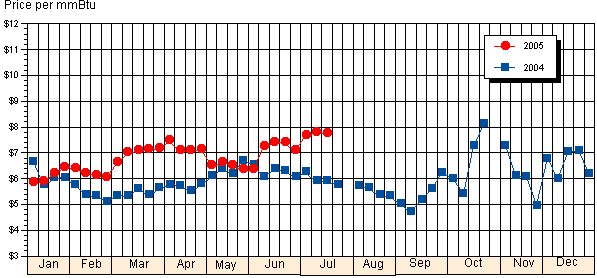
At the end of last week, hot and humid weather in most of the Lower 48 States were most likely factors in spot price increases, despite the influence of decreasing crude oil prices and the return of some natural gas production in the Gulf of Mexico.  As of July 19, the Minerals Management Service reported that 701 million cubic feet per day of natural gas production remained shut in, while on July 20, shut-in production had dropped to 616 million cubic feet per day.  For the week (Wednesday to Wednesday), the spot price at the Henry Hub fell 3 cents to $7.75 per million British thermal units (mmBtu).  The Henry Hub price was $1.96, or 34 percent, above last year's level of $5.79.

The amount of natural gas in storage in the East Region increased 3.9% for the week ending July 15 to 1,247 billion cubic feet which was 76 billion cubic feet above the 5-year average.  Nebraska is a part of the East Region (see map) which is a major natural gas consumer, particularly in the residential and commercial sectors.  The industrial sector, which includes agriculture, is also a major consumer in this state.  Most of the gas is supplied from the Producing Region with a fair amount imported from Canada.  The Henry Hub in southern Louisiana is a major market center with interconnections for many of the pipelines that transport U.S.-produced gas to the East Region.  Furthermore, the Henry Hub is the preferred reference point for prices for most of the domestic gas destined for the East.  Therefore, market conditions and developments in the East Region and price movements and trends at the Henry Hub are usually highly correlated.

Notes:  An archive is available.  Divide the price by ten (10) to obtain the price per hundred cubic feet (ccf) or the approximate price per therm.

Natural Gas Spot Prices at the Henry Hub
2004 and 2005

Natural Gas Spot Prices at the Henry Hub 2005

[Price per Million British Thermal Units (mmBtu)]

Day Jan Feb Mar Apr May Jun Jul Aug Sep Oct Nov Dec
1 $6.29 $6.64 $7.58 $6.36 $7.01 NA NA NA NA
2 $6.38 $6.61 $6.50 $6.65 NA NA NA NA
3 $5.53 $6.30 $6.72 $6.61 $6.65 NA NA NA
4 $5.70 $6.12 $6.52 $7.80 $6.49 Holiday NA NA NA
5 $5.84 $7.44 $6.66 $7.38 NA NA NA NA
6 $5.79 $7.46 $6.67 $7.05 $7.68 NA NA NA
7 $5.85 $6.03 $6.67 $7.51 $7.13 $7.62 NA NA NA NA
8 $5.95 $6.84 $7.27 $7.22 $7.87 NA NA NA NA
9 $6.20 $6.99 $6.56 $7.05 NA NA NA NA
10 $6.23 $6.21 $6.90 $6.67 $7.09 NA NA NA
11 $5.96 $6.03 $6.73 $7.17 $6.63 $7.35 NA NA NA
12 $5.89 $7.34 $6.63 $7.78 NA NA NA NA
13 $6.05 $7.07 $6.47 $7.08 $7.78 NA NA NA
14 $6.46 $5.95 $6.86 $7.02 $7.32 $8.00 NA NA NA NA
15 $6.01 $7.15 $6.95 $7.39 $8.03 NA NA NA NA
16 $6.11 $7.08 $6.45 $7.41 NA NA NA NA
17 Holiday $6.05 $7.24 $6.41 $7.60 NA NA NA
18 $6.68 $5.88 $7.12 $6.95 $6.50 $7.77 NA NA NA
19 $6.21 $7.01 $6.39 $7.70 NA NA NA NA
20 $6.26 $7.10 $6.37 $7.83 $7.75 NA NA NA
21 $6.43 Holiday $7.17 $6.93 $7.47 NA NA NA NA NA
22 $5.92 $7.25 $7.06 $7.40 NA NA NA NA NA
23 $6.02 $7.11 $6.34 $7.50 NA NA NA NA
24 $6.41 $6.32 $7.08 $6.45 $7.47 NA NA NA
25 $6.46 $6.27 Closed $7.27 $6.33 NA NA NA NA
26 $6.44 $7.08 $6.30 NA NA NA NA NA
27 $6.50 $7.11 $6.22 $7.29 NA NA NA NA
28 $6.24 $6.64 $6.94 $6.66 $7.05 NA NA NA NA NA
29 $6.94 $6.65 $7.07 NA NA NA NA NA
30 $7.17 Holiday $7.01 NA NA NA NA
31 $6.15 $7.47 $6.31 NA NA

Sources: Natural Gas Weekly Update. Energy Information Administration, Washington, DC.  Nebraska Energy Office, Lincoln, NE.

Note: NA = Not available.

This table was updated on July 22, 2005.

Typically, there is one week between updates.